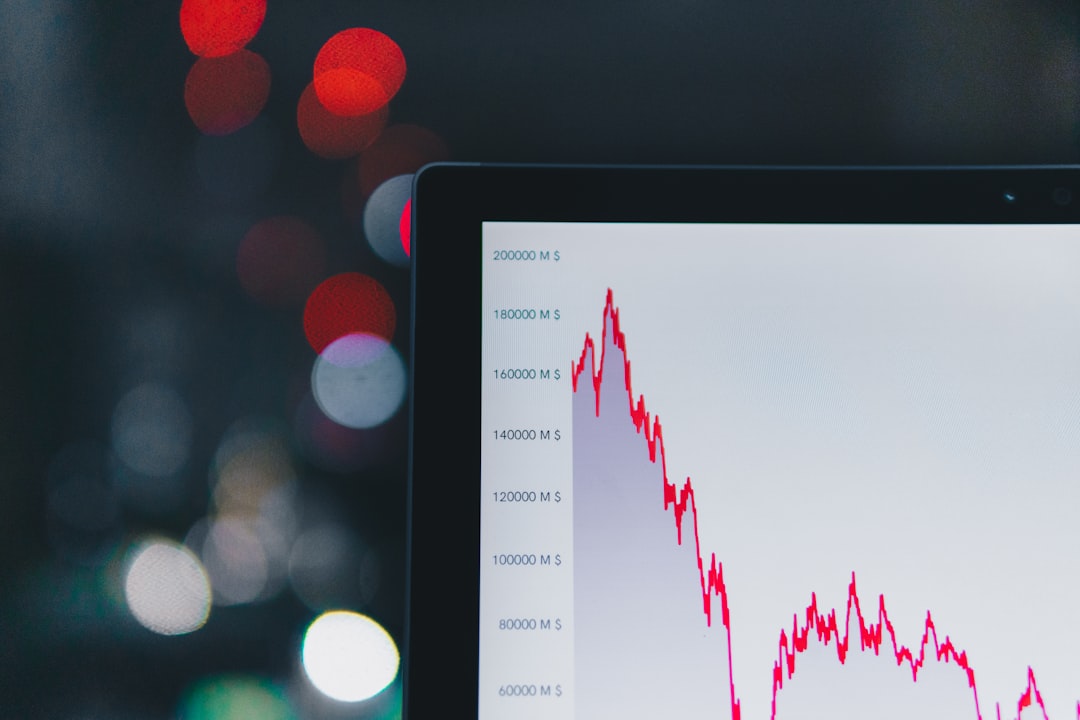
Have you ever felt caught between the fast-paced world of day trading and the long-term commitment of traditional investing? Many traders, myself included, have found a sweet spot that offers both excitement and significant profit potential: swing trading. It’s a strategy that lets you capitalize on price movements over a few days to several weeks, without the constant screen time of day trading. If you’re looking to capture those “swings” in the market and enhance your portfolio, you’re in the right place! Let’s dive in. 😊
What Exactly is Swing Trading? 🤔
Swing trading is a popular strategy where traders aim to capture short-to-medium term price movements in the stock market. Unlike day traders who close positions within a single day, swing traders hold positions for a few days to several weeks, taking advantage of price “swings” within a larger trend. This approach requires a clear understanding of price trends, momentum, and patterns.
It’s a fantastic middle ground for those who can’t constantly monitor the market but still want to profit from significant price fluctuations. The goal isn’t to predict the future, but to interpret current market behavior and make structured decisions based on high-quality setups.
Swing trading typically focuses on capturing 5-20 day trades with significant upside potential, often involving stocks with clear, recurring chart patterns and strong relative strength.
The Mechanics of Swing Trading: Strategies and Indicators 📊
Successful swing trading heavily relies on technical analysis to identify trading opportunities. Traders use various indicators to gain insights into market trends, momentum, and potential reversal points. These tools help in filtering noise from price movements, avoiding emotional decisions, improving timing, and maintaining consistency.
Key Indicators for Swing Trading in 2026
As of 2026, some of the most effective indicators for swing trading include:
| Indicator | Description | Typical Use in Swing Trading |
|---|---|---|
| Moving Averages (MA/EMA) | Smooths out price data to identify trend direction. EMAs (Exponential Moving Averages) are more sensitive to recent prices. | Identifying trend direction (price above MA = uptrend), dynamic support/resistance (20/50 EMA), and crossover signals. |
| Relative Strength Index (RSI) | A momentum oscillator (0-100 scale) measuring speed and change of price movements. | Identifying overbought (above 70) and oversold (below 30) conditions for reversals. In uptrends, buy when RSI pulls back to 40-50. |
| MACD (Moving Average Convergence Divergence) | A trend-following momentum indicator showing the relationship between two moving averages. | Trend confirmation and momentum. Bullish MACD cross above zero is a strong buy signal. |
| Bollinger Bands | Measure market volatility and identify potential price reversals. | Volatility tracking and mean reversion. Helps anticipate sharp price movements after consolidation. |
| Fibonacci Retracement | Identifies potential support and resistance levels based on Fibonacci sequences. | Pullback entries in trending markets (e.g., buying near 38.2%, 50%, or 61.8% retracement with confirmation). |
While indicators are powerful, relying on a single one can be misleading. Successful swing traders often combine 2-3 indicators for optimal results and to filter out false entries.
Core Checkpoints: What You Absolutely Need to Remember! 📌
Made it this far? Great! With so much information, it’s easy to forget the essentials. Let’s recap the three most crucial points to keep in mind for your swing trading journey.
-
✅
Risk Management is Non-Negotiable
Never risk more than 1-2% of your total account on any single trade, and always use stop-loss orders. This is your capital preservation strategy. -
✅
Trade with the Trend and Seek Confirmation
Align your trades with the long-term trend and always wait for a candle close confirmation before entering a trade to filter out false signals. -
✅
Embrace Continuous Learning and Adaptability
The market is constantly evolving, especially with AI. Stay updated, backtest your strategies, and be ready to adapt to new market conditions.
Current Trends & Market Insights for Swing Traders in 2026 👩💼👨💻
The year 2026 presents a dynamic landscape for swing traders. Algorithmic players, event-driven volatility, and fragmented momentum now dominate swing trading. Human intuition alone isn’t enough; successful traders are blending traditional techniques with machine-backed insights.
AI’s role is growing, with retail traders gaining access to algorithms and machine learning tools that process data in milliseconds. This means faster signals and smarter bots, making traditional strategies less reliable without adaptation. AI can assist with screening, analysis, journaling, and even identifying patterns unrecognizable to the human eye.
Current market sentiment shows mixed signals. As of early July 2026, the S&P 500 (SPY) is challenging recent highs, while the NASDAQ (QQQ) is making lower highs and hugging its 50-DMA. The VIX (Volatility Index) is back to levels not seen since the start of the year, around 15, indicating a relatively calmer market. Leading sectors include Energy and Health Care, while Technology and Materials have shown some weakness.
Volatility is both a risk and an opportunity. High volatility can signal potential downturns but also present unique entry opportunities as panic selling undervalues assets. During low volatility, traders might find opportunities for longer-term swing trades.
Real-World Example: A Hypothetical Swing Trade 📚
Let’s consider a simplified, hypothetical example of a swing trade using a common strategy: Mean Reversion to the 20 EMA in an uptrending stock. This strategy is best applied to stocks in a clear uptrend on the weekly chart.
Hypothetical Scenario: Tech Stock “AlphaCorp” (ALC)
- Situation: AlphaCorp (ALC) is in a strong uptrend on its weekly chart. On the daily chart, the price pulls back to its 20-day Exponential Moving Average (EMA). A bullish engulfing candle forms at this level, signaling a potential reversal.
- Account Size: $10,000
- Risk per trade: 1% of account = $100
Trading Steps
1) Entry: You decide to enter the trade at the close of the bullish engulfing candle at $50.00.
2) Stop-Loss: You place your stop-loss order just below the swing low that formed during the pullback, at $49.00. This limits your risk to $1.00 per share.
3) Position Sizing: With a $100 risk limit and $1.00 risk per share, you can buy 100 shares ($100 / $1.00 = 100 shares).
4) Target: You set your first profit target at the prior swing high, which is $53.00, aiming for a 3:1 risk-reward ratio ($3.00 potential profit / $1.00 risk).
Final Result (Hypothetical)
– Outcome: The price of AlphaCorp rallies over the next few days and hits your profit target of $53.00.
– Profit: ($53.00 – $50.00) * 100 shares = $300.00. This represents a 3% gain on your $10,000 account. While individual trades may seem small, consistent gains like this can lead to significant annual returns.
This example highlights the importance of having a clear entry, exit, and risk management plan before even placing a trade. It’s about being systematic, not emotional.
Wrapping Up: Key Takeaways 📝
Swing trading, when approached with discipline and a solid understanding of market dynamics, can be a highly profitable endeavor. It offers a balanced approach for those seeking to capitalize on short-to-medium term market movements, providing a middle ground between the intensity of day trading and the patience required for long-term investing.
Remember, success in swing trading isn’t just about finding the perfect indicator or the hottest stock. It’s about combining technical analysis with rigorous risk management, continuous learning, and adaptability to evolving market conditions, especially with the increasing influence of AI. Keep practicing, stay informed, and never stop refining your strategy. If you have any questions, feel free to ask in the comments below! 😊
Swing Trading Essentials
Limit risk to 1-2% of capital per trade; employ strict stop-loss orders.
Frequently Asked Questions ❓
