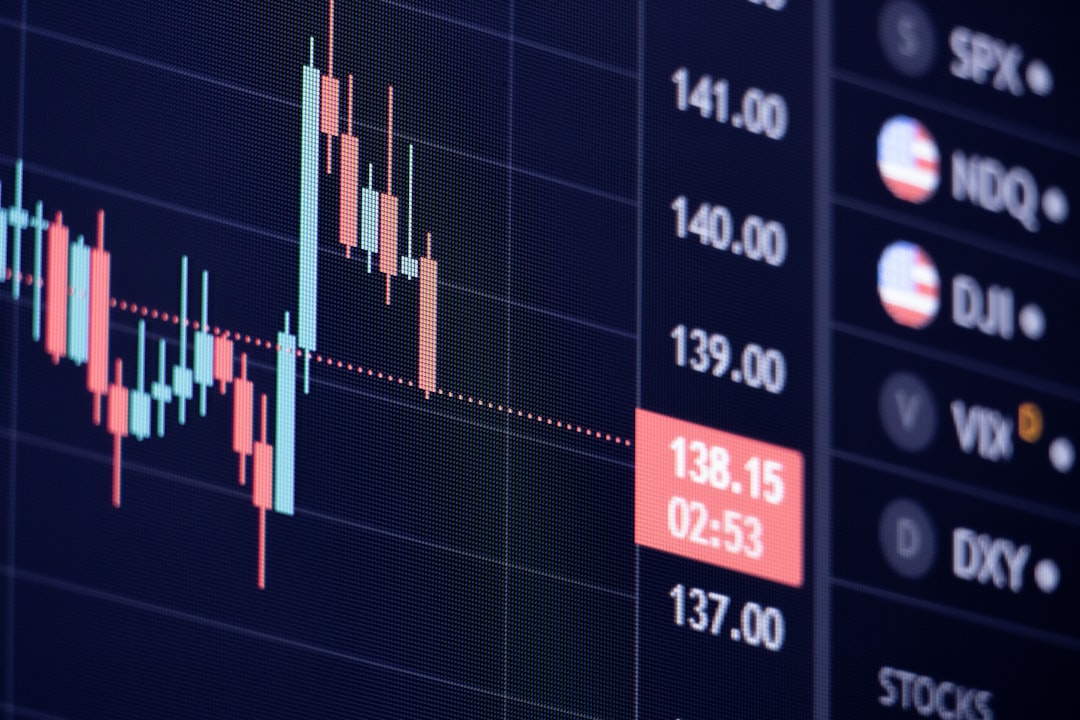
Have you ever felt overwhelmed by complex indicators and conflicting market signals in your forex trading journey? You’re not alone! Many traders, myself included, have sought a clearer, more intuitive approach to navigate the volatile world of currency exchange. That’s where price action trading comes in – a powerful methodology that focuses on the raw movements of price to uncover market psychology and predict future trends. In a market increasingly influenced by algorithmic and AI trading, understanding pure price behavior is more critical than ever. This guide will walk you through one of the most reliable and profitable FX trading strategies for 2026: Price Action with Support and Resistance. Let’s dive in! 😊
What is Price Action Trading? 🤔
Price action trading is a discipline where traders make decisions based on the analysis of raw price movements on a chart, without relying heavily on lagging indicators. It’s all about interpreting how buyers and sellers are interacting, and the resulting patterns and structures they leave behind. In 2026, price action remains a top Forex strategy because it focuses on real market behavior and works across all timeframes.
This method helps you anticipate future market trends and pinpoint high-probability trades. Instead of cluttering your charts with multiple indicators that can sometimes give delayed or false signals, price action traders look at candlestick patterns, market structure, and key support and resistance levels to gauge market sentiment and potential turning points.
The forex market in 2026 is characterized by increased volatility and smarter institutional traders. This makes strategies that focus on pure market behavior, like price action, even more relevant as they cut through the noise.
The Foundation: Support and Resistance Levels 📊
At the heart of price action trading lies the identification of support and resistance (S&R) levels. These are psychological price zones where buying or selling pressure tends to concentrate, creating predictable patterns. Support is a price floor where buying interest is strong enough to prevent further declines, while resistance acts as a ceiling where selling pressure typically overwhelms buyers.
Identifying these levels is crucial for determining potential entry and exit points, as well as placing stop-loss orders. You can spot S&R using historical price data, such as previous swing highs and lows, closing prices, and even psychological round numbers (e.g., 1.1000, 1.3500).
Key Methods for Identifying S&R in 2026
| Method | Description | Relevance in 2026 |
|---|---|---|
| Historical Price Points | Previous swing highs and lows, or significant closing prices where price reversed. | Still the bedrock; institutional traders often respect these levels. |
| Round Numbers | Psychological levels like 1.2000 or 1.2500, where many orders are clustered. | Highly effective on major pairs due to high trading volume and attention. |
| Trendlines | Diagonal lines connecting a series of rising lows (support) or declining highs (resistance). | Provide dynamic S&R, adapting to market conditions and trend momentum. |
| Moving Averages | Dynamic S&R where price often bounces or finds resistance in strong trends. | Useful for timing entries on pullbacks within a trend. |
S&R levels are zones, not exact lines. Price can often overshoot or undershoot these levels before reversing. Always look for confirmation with price action patterns before entering a trade to avoid false signals.
Key Checkpoints: What to Remember! 📌
Followed along so far? With a longer article, it’s easy to forget key points. Let’s recap the most crucial takeaways. Please keep these three things in mind:
-
✅
Price Action is About Pure Market Behavior
It’s about understanding supply and demand through candlestick patterns and chart structures, not relying on lagging indicators. This offers a direct insight into market psychology. -
✅
Support and Resistance are Your Trading Map
Identifying these key zones provides crucial entry, exit, and stop-loss points. They are the invisible barriers shaping price movements. -
✅
Always Seek Confluence and Confirmation
Combine S&R with candlestick patterns and overall market trends. The more signals aligning, the higher the probability of a successful trade.
Common Price Action Patterns to Watch 👩💼👨💻
Once you’ve identified your S&R levels, the next step is to look for specific candlestick patterns that signal a potential reversal or continuation. These patterns are the “language” of price action. Some of the most reliable patterns include:
- Pin Bar: A candlestick with a small body and a long wick, indicating a strong rejection of price at that level. A bullish pin bar at support suggests buyers are stepping in.
- Engulfing Pattern: A two-candle pattern where the second candle’s body completely engulfs the first, signaling a strong shift in momentum. A bullish engulfing pattern at support is a powerful buy signal.
- Inside Bar: A candle completely contained within the range of the previous candle, often indicating indecision or consolidation before a breakout.
- Double Tops/Bottoms: These are reversal patterns that form at resistance (double top) or support (double bottom), signaling exhaustion of the current trend. They are very simple to recognize and popular.
- Head and Shoulders: A classic reversal pattern with high accuracy, signaling a shift in trend.
While some patterns like the Head and Shoulders have historically shown high accuracy (up to 85%), remember that no pattern is 100% foolproof. Always combine pattern recognition with the context of S&R and overall market trends.
Integrating with Trend Analysis and Confluence 📚
The best price action traders don’t just look at isolated patterns; they integrate them with the broader market context. This means identifying the prevailing trend and looking for “confluence” – multiple factors aligning to support a trading idea. For instance, in July 2026, the USD has shown significant strength due to a “higher-for-longer” Fed rate environment and resilient growth.
When trading with price action, consider these:
- Trend is Your Friend: Trading with the trend generally offers higher probability setups. Look for bullish price action at support in an uptrend, or bearish price action at resistance in a downtrend.
- Multiple Timeframe Analysis: Confirm your S&R levels and price action patterns on higher timeframes (e.g., daily or 4-hour charts) before executing on lower timeframes (e.g., 1-hour or 15-minute charts). This provides a clearer picture of the overall market direction.
- Confluence: A trade setup is stronger when multiple elements align. For example, a bullish engulfing pattern forming at a strong historical support level, which also coincides with a trendline and a key Fibonacci retracement level, presents a high-probability trade.
Real-World Scenario: EUR/USD in July 2026
- Market Context: EUR/USD has been in a range-bound environment, struggling to gain momentum against a strong US dollar, trading around 1.14. The ECB hiked rates in June, but the Fed’s hawkish stance is dominating.
- Trader’s Observation: You notice EUR/USD approaching a significant historical support level at 1.1350 on the daily chart, a level that held firm in late 2025.
Trading Process
1) Identify Support: Mark the 1.1350 level as a key support zone based on historical data.
2) Watch for Price Action: As price reaches 1.1350, a large bullish pin bar forms on the 4-hour chart, rejecting lower prices. This indicates strong buying pressure entering the market at this critical level.
3) Confirm with Confluence: The overall sentiment for EUR/USD, while range-bound, shows potential for bounces off strong support. The pin bar further confirms buyer interest.
4) Entry & Risk Management: You decide to enter a long trade above the high of the bullish pin bar. Your stop-loss is placed just below the tail of the pin bar, and your take-profit target is set at the next resistance level (e.g., 1.1450).
Final Result
– Potential Outcome: Price rallies from the support level, hitting your take-profit target, demonstrating the effectiveness of combining S&R with price action.
This example illustrates how a disciplined approach to price action trading, focusing on key S&R levels and confirming patterns, can lead to profitable opportunities even in challenging market conditions. Always remember to practice on a demo account first to hone your skills without financial risk.
Wrapping Up: Your Path to FX Success 📝
Price action trading, particularly when combined with robust support and resistance analysis, offers a clear and powerful method for navigating the forex market. In 2026, with shifting market dynamics and the growing influence of advanced trading technologies, a strategy rooted in pure market behavior provides a timeless edge. By understanding what the charts are truly telling you, you can make more informed decisions, manage your risk effectively, and ultimately, improve your trading profitability.
Remember, consistent practice, disciplined risk management (like the 1-2% rule per trade), and continuous learning are your best allies in the forex world. Don’t be afraid to analyze your trades, learn from your mistakes, and adapt your approach as market conditions evolve. What are your favorite price action patterns? Let me know in the comments below! 😊
Price Action & S&R: Quick Summary
Frequently Asked Questions ❓