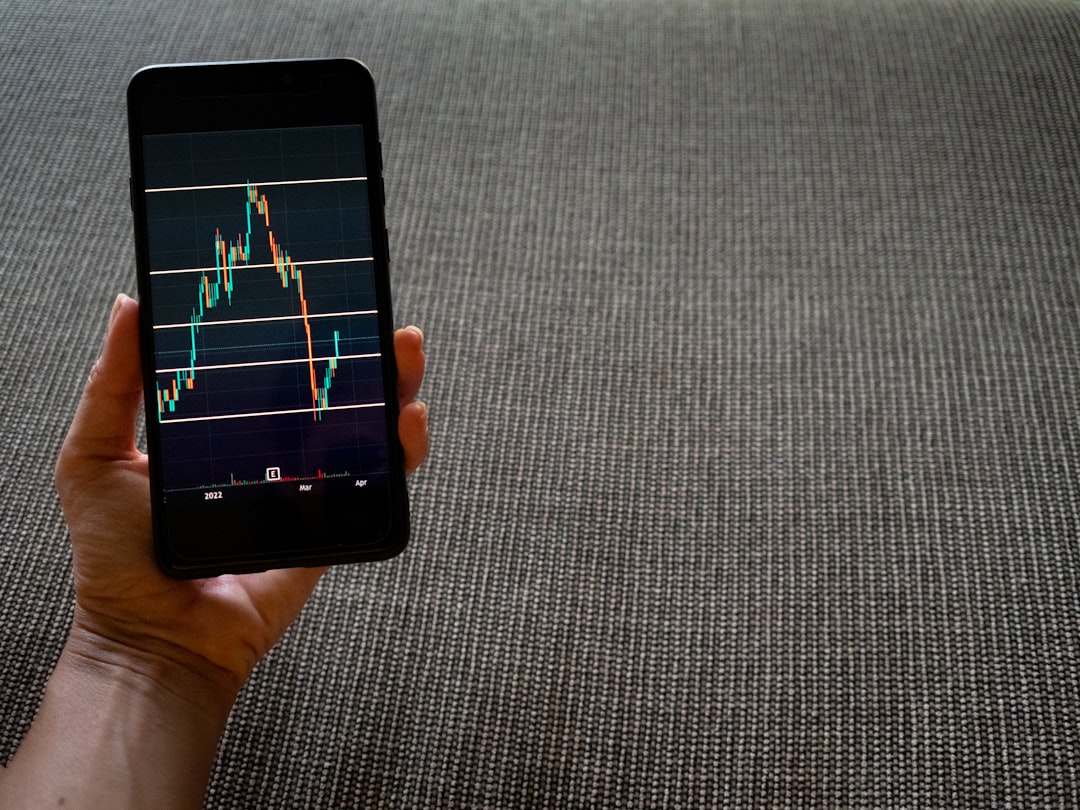
Have you ever felt like you’re missing out on stock market opportunities because day trading feels too fast-paced, and long-term investing too slow? I totally get it. It’s a common dilemma for many aspiring traders. The good news is, there’s a powerful middle ground that allows you to profit from significant price movements without the constant screen time: swing trading. In this article, we’re going to explore the ins and outs of swing trading, delve into the latest trends and essential tools for 2026, and show you how to build a robust strategy to potentially unlock your trading potential. Let’s dive in! 😊
What Exactly is Swing Trading? 🤔
Swing trading is a popular stock market strategy where traders aim to capture short to medium-term price movements, or “swings,” in a stock’s price. Unlike day trading, which involves opening and closing positions within the same day, swing traders typically hold their positions for a few days to several weeks. This approach allows traders to capitalize on trends that unfold over a longer period than intraday movements but shorter than long-term investments.
The core idea is to identify stocks that are poised for a significant price move, enter the trade, and then exit once that “swing” has largely played out. This means less time glued to your screen compared to day trading, making it an attractive option for those with other commitments.
Academic research from September 2023 tracked UK retail traders and found that swing traders achieved an average annual return of +2.1% after transaction costs, while day traders averaged -3.8%. This suggests swing trading can offer more stable performance.
Essential Indicators and Analysis for 2026 📊
To successfully navigate the market and identify profitable swings, swing traders heavily rely on technical analysis and specific indicators. These tools provide insights into price trends, momentum, and potential reversal points. Here are some of the most effective indicators for swing trading in 2026, often used in combination for better results.
Many experts suggest using 2-3 indicators maximum: one for trend, one for momentum, and one for confirmation, to avoid contradictory signals.
Key Technical Indicators for Swing Trading
| Category | Indicator | Purpose | 2026 Relevance |
|---|---|---|---|
| Trend | Moving Averages (MA/EMA) | Identify trend direction and dynamic support/resistance. | 20/50 EMA crossovers remain crucial for identifying trends. |
| Momentum | Relative Strength Index (RSI) | Measure speed and change of price movements; identify overbought/oversold conditions. | Still a powerhouse for reversals, especially divergences on daily charts. |
| Momentum | MACD (Moving Average Convergence Divergence) | Show relationship between two moving averages, confirms trend and momentum. | Bullish MACD cross above zero is a strong buy signal. |
| Volatility | Bollinger Bands | Measure market volatility and identify potential reversal points. | Bollinger squeeze signals imminent large moves. |
| Volume | On-Balance Volume (OBV) | Confirm price moves by measuring buying and selling pressure. | OBV rising with price confirms buying pressure. |
While swing trading offers advantages, it also carries risks, including overnight and weekend exposure to price gaps due to news or events outside market hours. Always use stop-loss techniques to manage potential losses.
Key Checkpoints: Remember These Essentials! 📌
You’ve made it this far! With all the information, it’s easy to forget the crucial details. So, let’s recap the absolute must-knows. Please keep these three points in mind.
-
✅
Swing Trading is Your Mid-Ground Advantage
It’s less demanding than day trading but more active than long-term investing, aiming for profits over days to weeks. -
✅
Technical Indicators Are Your Compass
Mastering 2-3 complementary indicators like EMAs, RSI, and MACD is crucial for identifying trends and reversals. -
✅
Risk Management is Non-Negotiable
Always define your entry, exit, and stop-loss points before entering a trade to protect your capital.
Developing Your Swing Trading Strategy 👩💼👨💻
Building a successful swing trading strategy involves more than just knowing indicators; it requires a disciplined approach to planning, execution, and risk management. Your strategy should be tailored to your risk tolerance and time availability.
Here are key steps to develop your swing trading strategy:
- Define Your Goals and Risk Tolerance: Understand how much you’re willing to risk per trade and what your profit targets are.
- Choose Your Market/Stocks: Focus on actively traded stocks and ETFs that tend to swing within well-defined channels.
- Identify Entry and Exit Points: Use your chosen technical indicators and chart patterns to determine optimal entry and exit signals.
- Implement Stop-Loss Orders: This is crucial for managing risk and limiting potential losses.
- Practice with a Demo Account: Before risking real capital, test your strategy in a simulated environment.
- Review and Adjust: Continuously analyze your trades, learn from your successes and failures, and refine your strategy.

A solid trading plan with defined entry, exit, and risk management rules is the cornerstone of successful swing trading. This helps remove emotion from your decisions.
Real-World Example: A Recent Swing Trade Scenario 📚
Let’s consider a hypothetical swing trade in the current market environment (September 2026). Recent market briefings indicate that energy stocks have been performing well, partly due to rising oil prices and geopolitical tensions. Meanwhile, some tech stocks have faced headwinds due to rising US 10-year yields.
Scenario: Capturing a Swing in an Energy Stock (XLE)
- Stock: Energy Select Sector SPDR Fund (XLE), representing the energy sector.
- Market Context (Early September 2026): Rising WTI crude prices, energy sector showing relative strength.
- Indicators Used: 20-day EMA (trend), RSI (momentum), Bollinger Bands (volatility).
Hypothetical Trade Process
1) Identification: XLE shows price above its 20-day EMA, indicating an uptrend. RSI pulls back to the 40-50 range (bullish pullback zone) after being overbought, suggesting a temporary dip within the trend. Bollinger Bands are starting to expand, signaling increasing volatility.
2) Entry: A swing trader might enter a long position as XLE bounces off its 20-day EMA, confirming support, and the RSI turns upwards from the bullish pullback zone. Entry at $90.00.
3) Stop-Loss: A protective stop-loss is placed just below the 20-day EMA or a recent support level, say at $88.50.
4) Target: Based on previous swing highs and Bollinger Band upper limits, a target of $94.50 (a 5% gain) is set, aligning with typical swing trade profit goals of 5-10%.
5) Exit: As XLE approaches $94.50 and the RSI moves into overbought territory (above 70), the trader exits the position, capturing the upward swing.
Final Outcome
– Entry Price: $90.00
– Exit Price: $94.50
– Gross Profit: $4.50 per share (5% gain) over a few days.
This example illustrates how combining indicators with market context can help identify and execute profitable swing trades. Remember, successful swing trading is about consistent small to medium gains that compound over time.
Conclusion: Your Path to Profitable Swing Trading 📝
Swing trading offers a compelling strategy for those looking to actively participate in the stock market without the intensity of day trading. By understanding its principles, mastering key technical indicators, and adhering to a disciplined trading plan, you can position yourself to capture profitable market swings. While September 2026 presents its own unique market dynamics, the core tenets of swing trading remain timeless.
Remember, consistent profitability in swing trading comes from a combination of sound analysis, robust risk management, and continuous learning. Don’t be afraid to start small, learn from every trade, and always prioritize protecting your capital. If you have any questions or want to share your swing trading experiences, please leave a comment below! Happy trading! 😊