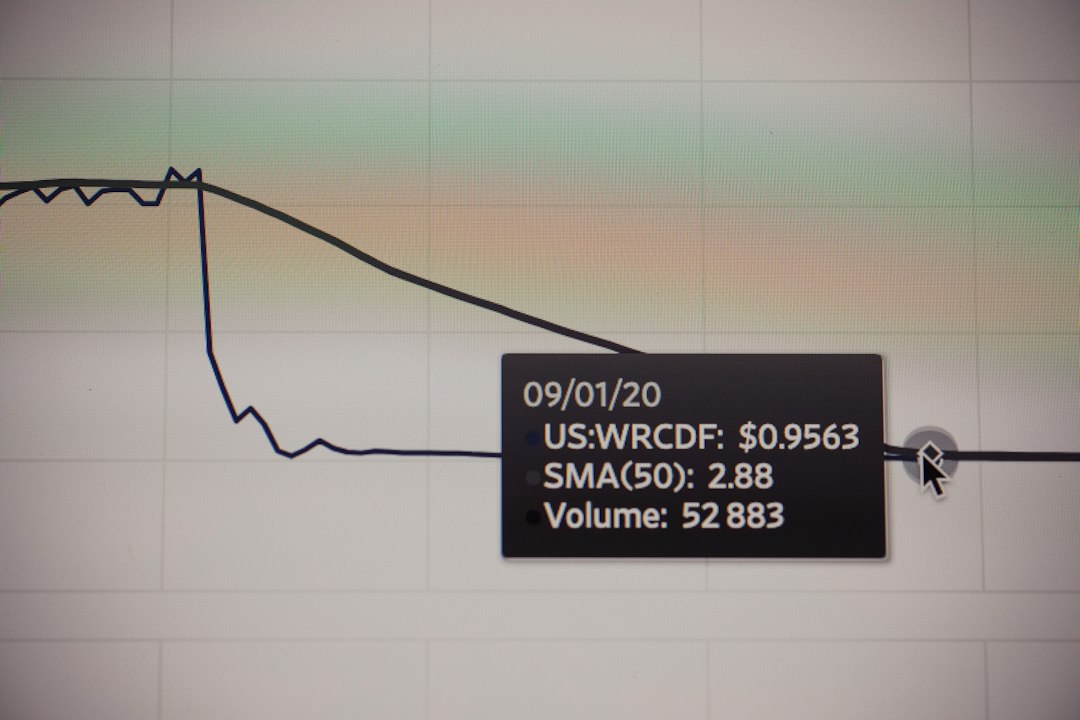
Have you ever felt lost in the vast, volatile world of Forex trading? It’s a common feeling. With daily turnovers reaching an estimated $7.5 trillion in 2026, the foreign exchange market offers immense opportunities, but also significant challenges. Many aspiring traders struggle to find a reliable method to navigate currency fluctuations and secure consistent gains. But what if there was a straightforward, yet powerful, strategy to cut through the noise and identify high-probability trades? Today, we’re diving deep into one such proven technique: the Moving Average Crossover strategy. Let’s unlock your trading potential! 😊
Understanding Trend Following: The Foundation of Success 🤔
Before we delve into the specifics of moving averages, it’s crucial to grasp the concept of trend following. Trend following is a systematic trading approach that aims to capitalize on sustained price movements in one direction. Instead of trying to predict market tops or bottoms, trend followers simply “ride the wave” of an established trend, whether it’s an uptrend or a downtrend. This strategy is often cited as one of the most reliable and widely used by professional traders in 2026, especially for capturing extended price movements.
The core philosophy is that once a trend begins, it is more likely to continue than to reverse immediately. This approach minimizes the need for constant prediction and instead focuses on reacting to market behavior. It’s adaptable across various asset classes, including Forex, and can be applied to different timeframes, from short-term intraday charts to longer-term weekly setups.
The global Forex market is projected to reach $1,592.1 billion by 2034, growing at a CAGR of 6.31% from 2026-2034. This growth is driven by factors like interest rates, inflation, geopolitical events, and central bank policies.
The Power of Moving Averages: Your Trend Detectors 📊
Moving Averages (MAs) are fundamental technical indicators that smooth out price data over a specific period, making it easier to identify the underlying trend. They are “trend following” indicators by nature, meaning they work exceptionally well when a market is trending but can generate false signals in sideways or choppy markets.
There are two primary types of moving averages: the Simple Moving Average (SMA) and the Exponential Moving Average (EMA). While both serve to identify trends, they differ in their calculation. SMAs give equal weight to all prices in the period, whereas EMAs give more weight to recent prices, making them more responsive to new information. This responsiveness is often preferred by traders looking for quicker signals.

SMA vs. EMA: A Quick Comparison
| Category | Simple Moving Average (SMA) | Exponential Moving Average (EMA) | Ideal Use Case |
|---|---|---|---|
| Responsiveness | Slower to react to new prices | Faster to react to new prices | Long-term trend identification |
| Weighting | Equal weight to all data points | More weight to recent data points | Short-to-medium term trends, faster signals |
| Lag | More lagging | Less lagging | Reacting quickly to market shifts |
| False Signals | Fewer in choppy markets | More in choppy markets (due to responsiveness) | Consolidating trends, reducing whipsaws |
Moving Averages are lagging indicators. This means they confirm a trend after it has already started. Relying solely on MAs can lead to delayed entries or exits, especially in fast-moving markets or during reversals. Always combine them with other tools for confirmation.
Key Checkpoints: Remember These! 📌
Have you followed along well so far? Since this article is quite detailed, I’ll highlight the most important points again. Please keep these three things in mind.
-
✅
Trend Following is Key
Successful FX trading often means identifying and trading with the prevailing market trend, not against it. -
✅
Moving Averages as Trend Filters
EMAs are generally preferred for their responsiveness in identifying current trends compared to SMAs. -
✅
Risk Management is Non-Negotiable
Always use stop-losses and proper position sizing to protect your capital from inevitable drawdowns.
Implementing the EMA Crossover Strategy for Profit 👩💼👨💻
The Moving Average Crossover strategy involves using two or more moving averages of different periods. A common and effective approach uses a short-period EMA (e.g., 20 or 50) and a long-period EMA (e.g., 100 or 200). The crossover of these two lines generates buy or sell signals.
Here’s how it generally works:
- Bullish Signal (Buy): When the shorter-period EMA crosses above the longer-period EMA, it indicates a potential uptrend. This is often referred to as a “Golden Cross” when using 50-day and 200-day MAs.
- Bearish Signal (Sell): Conversely, when the shorter-period EMA crosses below the longer-period EMA, it signals a potential downtrend. This is known as a “Death Cross” with 50-day and 200-day MAs.
In 2026, market conditions are increasingly driven by fundamental factors like interest rate differentials and central bank policies. While technical indicators like EMAs are powerful, integrating fundamental analysis can provide a more robust trading edge. For instance, a strong bullish EMA crossover on EUR/USD might be even more compelling if the European Central Bank is signaling a hawkish stance compared to the Federal Reserve.
To filter out false signals, especially in choppy markets, always seek confirmation from other indicators. Popular choices include the Relative Strength Index (RSI), MACD, or even price action patterns like candlestick formations.
Real-World Example: Applying the EMA Crossover Strategy 📚
Let’s walk through a hypothetical example using the 50-period EMA and 200-period EMA on a daily chart for the EUR/USD pair, a dominant pair in the Forex market.
Trader Sarah’s Scenario (Early 2026)
- Currency Pair: EUR/USD
- Timeframe: Daily Chart
- Indicators: 50 EMA (fast), 200 EMA (slow)
- Market Context (January 2026): Initial forecasts suggest potential USD depreciation, with the EUR expected to break above 1.2000.
Trading Process
1) Trend Identification: Sarah observes that the EUR/USD had been in a prolonged downtrend in late 2025. However, in early January 2026, the 50 EMA starts to flatten and then turns upwards, approaching the 200 EMA.
2) Entry Signal: Around mid-January 2026, the 50 EMA crosses decisively above the 200 EMA. This “Golden Cross” signals a potential shift to an uptrend. Sarah also notes that the RSI is moving above 50, confirming bullish momentum. She decides to enter a long position (buy EUR/USD) at 1.0950.
3) Risk Management: She places her stop-loss order below the recent swing low and the 200 EMA, at 1.0880, adhering to a strict 1% risk per trade.
4) Trade Management: As EUR/USD rises through February and March 2026, Sarah trails her stop-loss to lock in profits. She observes news about the ECB potentially maintaining higher rates, reinforcing the bullish sentiment.
5) Exit Signal: In late March, the 50 EMA starts to flatten, and EUR/USD shows signs of losing momentum, with the RSI dipping below 70 (from overbought) and forming a bearish divergence. Although no bearish crossover has occurred, Sarah decides to exit her position proactively at 1.1200, based on weakening momentum and price action confirmation.
Final Outcome
– Entry Price: 1.0950
– Exit Price: 1.1200
– Profit: 250 pips (1.1200 – 1.0950 = 0.0250, or 250 pips)
This example illustrates how combining EMA crossovers with sound risk management and complementary indicators can lead to profitable outcomes. Remember, consistency and discipline are paramount in applying any trading strategy.
Wrapping Up: Key Takeaways 📝
The Moving Average Crossover strategy offers a powerful, systematic approach to profiting from trends in the Forex market. By understanding the responsiveness of EMAs and combining them with disciplined risk management and additional confirmation tools, you can enhance your trading decisions. The Forex market in 2026 continues to present dynamic opportunities, and mastering such a strategy can be a significant step toward achieving your financial goals.
Start by practicing on a demo account, refine your settings, and always prioritize protecting your capital. The journey to consistent profitability is a marathon, not a sprint. Do you have any questions or want to share your own experiences with this strategy? Feel free to leave a comment below! 😊