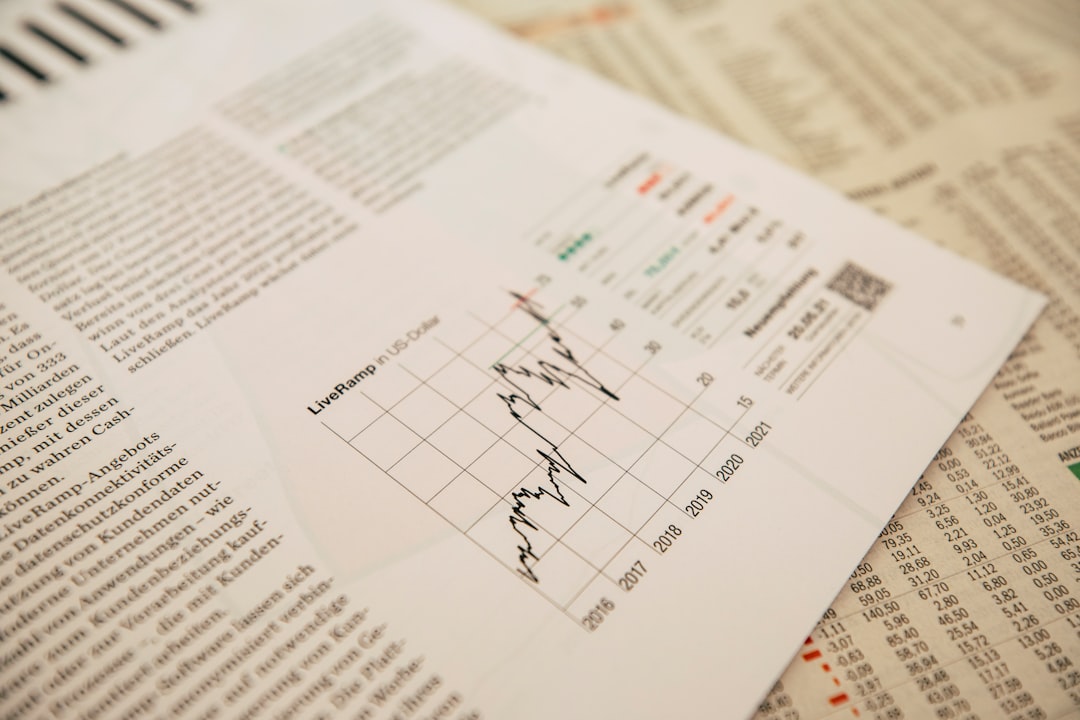
Have you ever felt overwhelmed by the sheer number of indicators and strategies out there for Forex trading? I know I have! It’s like trying to find a needle in a haystack, and often, those complex systems just lead to more confusion and frustration. But what if I told you there’s a way to cut through the noise and truly understand what the market is telling you, directly from the charts themselves? Welcome to the world of Price Action Trading, a powerful methodology that many professional traders swear by. It’s about simplicity, clarity, and making informed decisions based on raw price movements. Ready to dive in and simplify your trading journey? Let’s go! 😊
What Exactly is Price Action Trading? 🤔
At its core, Price Action Trading is the discipline of making all your trading decisions based solely on the price movements on a chart, rather than relying on lagging indicators. Think of it as reading the market’s “language” through candlestick patterns, support and resistance levels, trend lines, and chart formations. It’s the belief that all relevant information – supply, demand, psychology – is already reflected in the price itself. This approach strips away the complexity, allowing traders to focus on the pure mechanics of buying and selling.
Many traders find this method liberating because it promotes a deeper understanding of market dynamics. Instead of chasing signals from a multitude of indicators, you’re learning to interpret the intentions of buyers and sellers directly. This often leads to more timely entries and exits, as you’re reacting to real-time price shifts, not delayed calculations.
Price Action Trading is highly adaptable across different timeframes, from short-term scalping to long-term swing trading. This flexibility makes it a favorite among diverse traders, from day traders looking for quick entries to positional traders holding for weeks.

Key Components of Price Action Trading 📊
To effectively trade price action, you need to understand its fundamental building blocks. These elements help you decipher the market’s narrative and identify high-probability trading opportunities.
One of the most crucial aspects is identifying strong support and resistance levels. These are areas where price has historically reversed, indicating significant buying or selling interest. They act as invisible barriers that price struggles to break through. Recognizing these levels allows you to anticipate potential turning points in the market.
Common Price Action Patterns
| Pattern | Description | Significance | Example |
|---|---|---|---|
| Pin Bar | Small body, long wick extending from one side, often rejecting a level. | Reversal signal. Long wick shows rejection of price. | Bullish Pin Bar at support suggests buying pressure. |
| Engulfing Bar | Large candle completely covers the previous candle’s body. | Strong reversal or continuation signal. | Bearish Engulfing after an uptrend indicates potential reversal. |
| Inside Bar | A candle whose entire range (high to low) is within the previous candle. | Indicates consolidation or indecision, often preceding a breakout. | Breakout from an Inside Bar can signal trend continuation. |
| Doji | Open and close prices are virtually the same, forming a cross or plus sign. | Indecision in the market. Can signal a potential reversal if at extremes. | Doji after a strong trend suggests exhaustion and potential reversal. |
Never trade a single price action pattern in isolation. Always confirm patterns with surrounding context, such as support/resistance levels, trend direction, and overall market sentiment. A pattern without context is often meaningless.
Key Checkpoints: Remember These! 📌
Have you been following along well? This article is quite long, so I’ll recap the most important takeaways. Please remember these three things above all else.
-
✅
Price is King:
All market information is embedded in price action. Focus on raw price movements to understand supply and demand. -
✅
Context is Crucial:
Always consider support/resistance, trend, and overall market sentiment when interpreting price patterns. -
✅
Risk Management is Non-Negotiable:
No strategy is 100% foolproof. Always define your stop-loss and position size before entering a trade to protect your capital.
Integrating Market Trends & News (October 2026) 👩💼👨💻
While Price Action Trading emphasizes raw chart analysis, ignoring broader market trends and significant news events would be a disservice. Fundamental analysis provides the “why” behind price movements, while price action tells you the “when” and “how.” In October 2026, global economic data, central bank policies (especially from the Fed, ECB, and BoJ), and geopolitical developments continue to be major drivers in the Forex market. High-impact news releases like Non-Farm Payrolls, CPI data, and interest rate decisions can cause significant volatility, often leading to rapid price action that can be either opportunities or traps.
For instance, recent inflation data from the US has shown some stabilization, leading to speculation about the Federal Reserve’s next moves. This kind of information can influence the strength of the USD, creating clearer trends or ranges that price action traders can exploit. Similarly, ongoing energy market dynamics and supply chain adjustments continue to affect commodity-linked currencies like the AUD and CAD. Keeping an eye on these broader narratives helps confirm the validity of your price action setups, adding an extra layer of confidence to your trades.
Always check an economic calendar before trading, especially for major currency pairs. Trading around high-impact news can be extremely risky due to unpredictable spikes and increased spreads. It’s often safer to wait for the initial volatility to subside and then look for clear price action setups.
Practical Example: Trading a Bullish Engulfing Pattern 📚
Let’s walk through a hypothetical scenario to see how Price Action Trading might work in practice. Imagine you’re looking at the EUR/USD 4-hour chart.
Trader’s Situation
- Currency Pair: EUR/USD
- Timeframe: 4-hour chart
- Observation: Price has been in a downtrend for the past few days, approaching a significant historical support level at 1.0500.
Analysis Process
1) Identify Support: The price hits the 1.0500 support level, which has held strong multiple times in the past.
2) Spot the Pattern: A small bearish candle forms at support, followed immediately by a large bullish candle that completely engulfs the previous bearish candle. This is a classic Bullish Engulfing pattern, indicating a strong shift from selling to buying pressure at a key level.
3) Confirm Context: The pattern occurs at a significant support level, confirming its potential validity. The overall trend was down, but the engulfing pattern suggests a possible short-term reversal or at least a bounce.
Trading Decision & Outcome
– Entry: The trader decides to enter a ‘buy’ trade (long) at the close of the bullish engulfing candle, around 1.0520.
– Stop Loss: A stop-loss is placed just below the low of the engulfing pattern (and below the 1.0500 support level), perhaps at 1.0480, limiting potential losses.
– Take Profit: A take-profit target is set at the next significant resistance level, say 1.0650, aiming for a favorable risk-to-reward ratio.
In this example, the price action trader didn’t need any complex indicators to make a decision. They simply read the story the candlesticks were telling them at a critical market juncture. This trade, if successful, would yield a good profit with clearly defined risk. It’s all about letting the market guide your decisions, not the other way around.
Conclusion: Summarizing Key Takeaways 📝
Price Action Trading offers a powerful, clear, and logical approach to navigating the Forex market. By focusing on the pure movements of price, you can develop a deeper intuition for market dynamics and make more informed trading decisions, free from the clutter of excessive indicators.
Remember, consistent profitability comes from disciplined application, understanding market context, and rigorous risk management. It’s a skill that improves with practice, so start observing those charts today! If you have any questions or want to share your price action trading experiences, feel free to leave a comment below! 😊