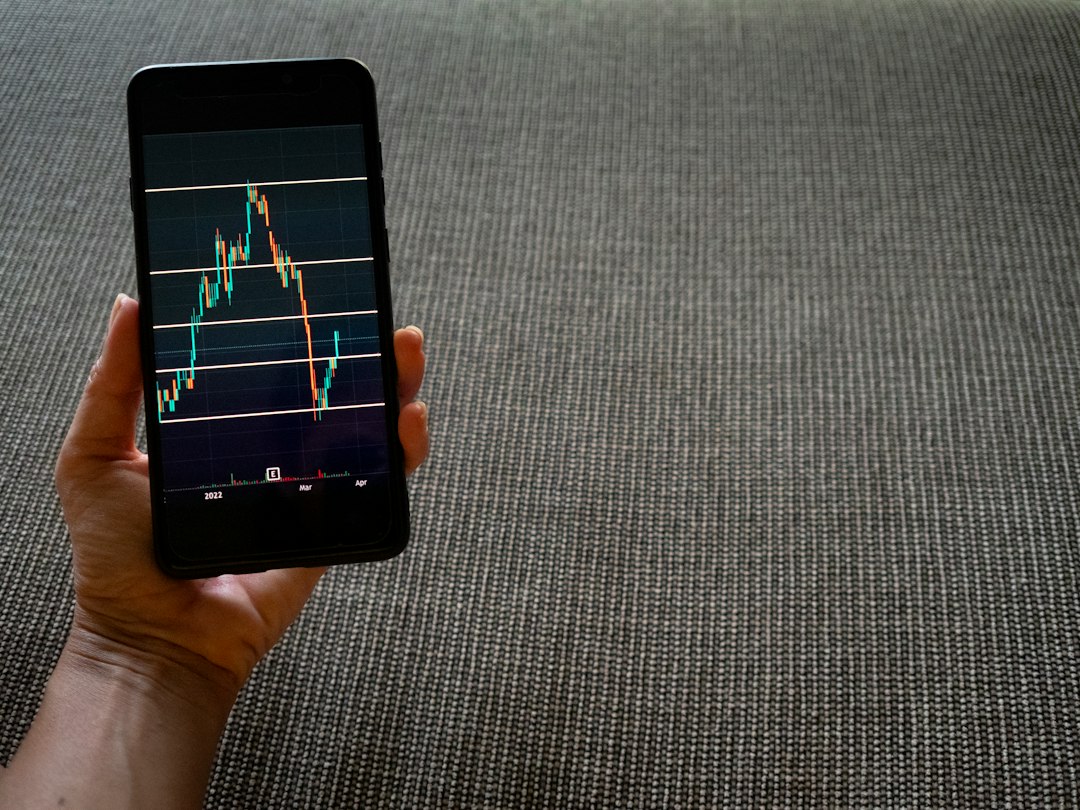
Have you ever felt caught between the fast-paced world of day trading and the long-term patience of traditional investing? Many traders, myself included, have found a sweet spot in the middle: swing trading. It’s a dynamic approach that allows you to capture significant price movements over days or weeks, without the intense screen time demanded by day trading. With market conditions constantly evolving, especially in 2026, understanding a robust strategy like swing trading is more relevant than ever. Let’s dive into how you can leverage this method to potentially boost your trading success! 😊
What Exactly is Swing Trading? 🤔
Swing trading is a speculative strategy designed to capture short- to intermediate-term price moves by holding positions for a few days to several weeks. Unlike day traders who close all positions before the market closes, swing traders hold positions overnight, exposing them to overnight risk. Conversely, it doesn’t demand the years-long commitment of buy-and-hold investing.
This trading style focuses on profiting from one “swing” in price – one directional move within a larger trend or range. Swing traders don’t aim to catch the exact top or bottom; instead, they target the middle of a move, entering after evidence that a swing has begun and exiting at a predefined target or stop.
In 2026, swing trading has gained popularity due to its flexibility and more realistic time commitment compared to day trading, especially for individuals with other responsibilities.
Key Indicators and Tools for 2026 Swing Traders 📊
Successful swing trading heavily relies on technical analysis to identify potential entry and exit points. The market in 2026 continues to favor traders who can effectively use a combination of indicators to spot trends, momentum, and key price levels.
Commonly used technical indicators for swing trading include Moving Averages (MA), Relative Strength Index (RSI), Moving Average Convergence Divergence (MACD), Stochastic Oscillators, and Average True Range (ATR). These are typically read on daily charts to filter out short-term noise and focus on more significant price movements.
Essential Technical Indicators for Swing Trading
| Indicator | Purpose | Typical Setting | Role in Strategy |
|---|---|---|---|
| Moving Averages (MA) | Identify trend direction and dynamic support/resistance. | 50-period, 200-period | Confirm overall trend, spot pullbacks. |
| Relative Strength Index (RSI) | Measure momentum and identify overbought/oversold conditions. | 14-period | Signal potential reversals or trend continuation. |
| MACD | Show relationship between two moving averages, spot momentum shifts. | 12, 26, 9 | Confirm trend strength and potential entry/exit signals. |
| Average True Range (ATR) | Measure market volatility to help set stop-loss levels. | 14-period | Crucial for risk management and position sizing. |
While indicators are powerful, relying on too many that measure the same thing (e.g., three momentum oscillators) can create false confidence. Focus on a small, complementary set.
Key Checkpoints: Remember These Essentials! 📌
You’ve made it this far! With a longer article, it’s easy to forget key points. So, let’s quickly recap the most crucial takeaways. Please keep these three things in mind:
-
✅
Swing Trading is a Middle Ground Strategy
It offers flexibility and a more realistic time commitment than day trading, focusing on multi-day to multi-week price movements. -
✅
Technical Analysis is Your Core Tool
Mastering indicators like MAs, RSI, and MACD on daily charts is crucial for identifying trends, momentum, and optimal entry/exit points. -
✅
Risk Management is Paramount
Always define your stop-loss and profit target before entering a trade, aiming for a minimum 1:2 risk/reward ratio to protect your capital.
Recent Trends and Market Insights for Swing Traders in 2026 👩💼👨💻
The financial markets in 2026 are shaped by several factors that impact swing trading opportunities. We’ve seen continued influence from elevated interest rates in many economies, though some forecasts suggest a potential for rate cuts by late 2026. Inflation has cooled but remains a factor, and geopolitical uncertainties continue to drive volatility and sector rotation.
Energy and tangible asset sectors like Materials and Industrials have shown strong performance in 2026, with the Energy sector (XLE) leading with significant year-to-date gains as of September. High-beta technology stocks, while offering volatility, can be treacherous with rising bond yields. Defensive sectors like Utilities and Healthcare also provide opportunities for safety swings during market headwinds.
Furthermore, the increasing accessibility of AI-assisted tools for retail traders is a significant trend. While AI drives a substantial portion of global trading volume (nearly 89% in 2026), these tools can help with predictive analytics and real-time decision-making, though discipline remains key.
The U.S. move to T+1 settlement has shortened settlement times, and fractional shares have made position sizing easier for smaller accounts, both benefiting swing traders by improving execution and risk management.
Practical Example: Identifying a Swing Trade Setup 📚
Let’s walk through a hypothetical scenario to illustrate how a swing trade might be identified and executed based on the current market environment and technical indicators.
Scenario: Energy Sector Pullback Opportunity
- **Stock:** “EnerCo” (ticker: ECO), a leading company in the Energy sector, which has been in a strong uptrend throughout 2026.
- **Observation:** ECO’s price has recently pulled back towards its 50-day Moving Average (MA) on the daily chart, which is acting as dynamic support. The Relative Strength Index (RSI) has moved from overbought territory (above 70) to around the 50-60 range, indicating a healthy consolidation rather than a strong reversal.
- **Catalyst:** A recent positive analyst report on the energy sector reinforces the bullish outlook.
Trade Plan and Execution
1) **Entry:** A bullish engulfing candlestick pattern forms at the 50-day MA, confirming buyer interest. You decide to enter at the close of this candle at $105.
2) **Stop-Loss:** Based on the Average True Range (ATR), you place your stop-loss just below the swing low that formed during the pullback, at $102. This limits your risk to $3 per share.
3) **Profit Target:** Aiming for a 1:2 risk/reward ratio, your target is $111 ($105 + $6 profit). This aligns with a previous resistance level.
Final Result (Hypothetical)
– **Outcome:** Over the next five trading days, ECO continues its uptrend, driven by renewed buying in the sector. The stock reaches your target of $111, and you close the position for a profitable gain.
– **Key Takeaway:** The trade capitalized on an established trend, a clear pullback to support, and a defined risk-reward profile, demonstrating the core principles of swing trading.

This example highlights the importance of a structured approach. By combining trend identification, technical confirmation, and strict risk management, swing traders can navigate the markets with greater confidence. Remember, a well-defined plan is your best defense against emotional trading.
Wrapping Up: Key Takeaways 📝
Swing trading offers a compelling path for individuals looking to actively participate in the stock market without the extreme demands of day trading. In 2026, with evolving market dynamics, increased accessibility to trading tools, and persistent sector rotations, the opportunities for skilled swing traders are significant.
Remember, success in swing trading isn’t about predicting every market move perfectly, but about having a disciplined strategy, understanding your tools, and rigorously managing risk. It’s a continuous learning process, but with a solid foundation, you can confidently navigate the swings of the market. If you have any questions or want to share your swing trading experiences, feel free to drop a comment below! 😊
Swing Trading Essentials: Your Quick Reference
Always define stop-loss and profit targets before entry.
Frequently Asked Questions ❓