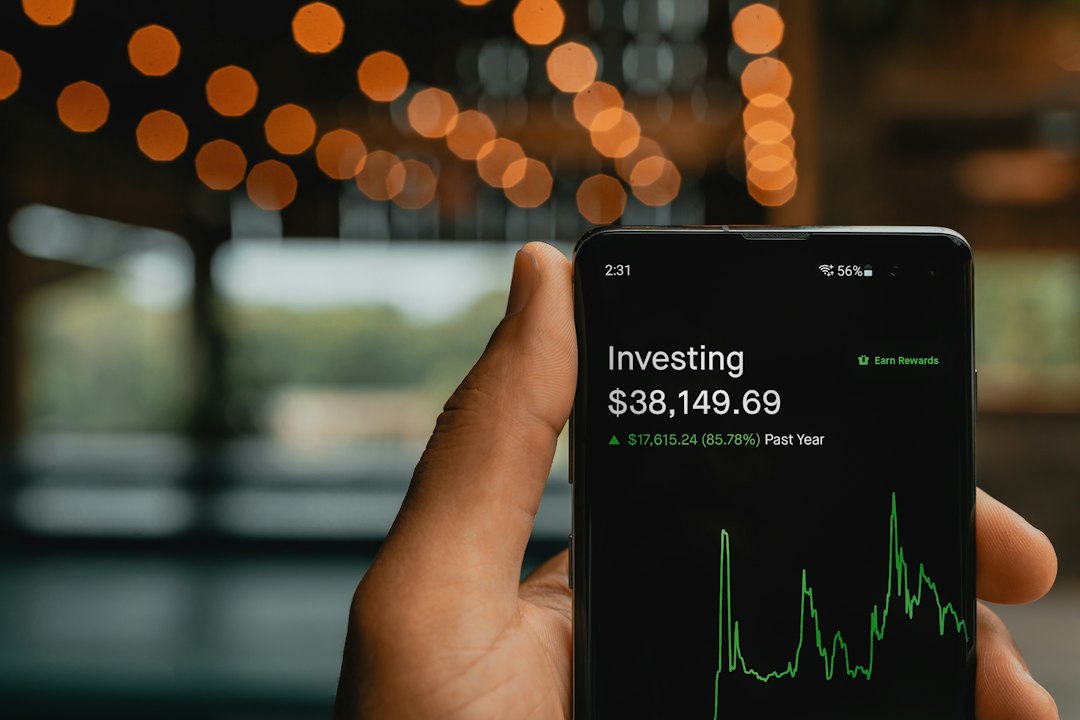
Have you ever felt caught between the rapid-fire decisions of day trading and the long-term patience of investing? Many traders find themselves in this sweet spot, seeking to capitalize on market movements without being glued to their screens all day. That’s where swing trading comes into play, offering a flexible and potentially rewarding path to profit. If you’re looking to understand a powerful trading technique that balances activity with thoughtful strategy, you’re in the right place! Let’s dive in. 😊
What Exactly is Swing Trading? 🤔
Swing trading is a popular strategy that aims to profit from short- to medium-term price changes in financial assets, typically over a period of a few days to several weeks. Unlike day trading, where positions are opened and closed within the same day, swing traders hold positions overnight, allowing them more time for research and planning. However, it’s still a more active approach than long-term investing, which focuses on holding assets for months or years.
The core idea is to capture a “swing” in the market – a portion of an expected price movement – rather than trying to predict the absolute beginning or end of a trend. This approach often relies heavily on technical analysis to identify potential entry and exit points, looking for patterns and signals in price charts.
Swing trading offers a middle ground between the fast pace of day trading and the longer patience of investing, making it suitable for those interested in mid-term price movements without a full-time commitment to market monitoring.
Key Indicators and Tools for Swing Traders 📊
Successful swing traders use a variety of technical indicators to gain insights into market trends, momentum, volatility, and potential reversal points. Combining multiple indicators can help confirm signals and reduce risks. Here are some of the most effective and widely used indicators in 2026:
Essential Technical Indicators for Swing Trading
| Indicator | Description | Use in Swing Trading |
|---|---|---|
| Moving Averages (MA) | Smooths price data to identify trend direction. Can be Simple (SMA) or Exponential (EMA). | Identifies dominant trends, potential support/resistance levels, and crossover signals. |
| Relative Strength Index (RSI) | A momentum oscillator measuring the speed and change of price movements, typically ranging from 0 to 100. | Helps spot overbought (>70) or oversold (<30) conditions, signaling potential reversals. |
| MACD (Moving Average Convergence Divergence) | A trend-following momentum indicator showing the relationship between two moving averages. | Generates buy/sell signals and helps spot potential reversal points. |
| Bollinger Bands | Consist of a moving average and two standard deviation bands, indicating volatility. | Measures price fluctuation, identifies overbought/oversold levels, and signals changes in volatility. |
Other valuable tools include Volume Indicators (like On-Balance Volume) to confirm trend strength, and Fibonacci Retracement to identify potential support and resistance levels. It’s crucial to remember that no single indicator is perfect; combining them and testing your setups will improve accuracy.
While swing trading offers less stress than day trading, it still carries significant risks. Holding positions overnight exposes you to potential gaps at market open due to unexpected news or events. Always be prepared for losses and manage your risk diligently.
Key Checkpoints: Remember These Essentials! 📌
You’ve come this far! With all this information, it’s easy to forget the crucial points. Let’s recap the three most important takeaways from our discussion so far:
-
✅
Swing Trading is a Balanced Approach
It’s a middle-ground strategy, less demanding than day trading but more active than long-term investing, making it ideal for capturing mid-term price movements. -
✅
Technical Analysis is Your Compass
Utilize key indicators like MAs, RSI, and MACD to identify trends, momentum, and potential reversals for informed decision-making. -
✅
Risk Management is Non-Negotiable
Always set stop-losses, define risk-reward ratios, and size your positions correctly to protect your capital from significant losses.
Current Trends and Market Insights for 2026 👩💼👨💻
As of November 2026, the trading landscape continues to evolve rapidly, driven by technological advancements and shifting market dynamics. One significant trend is the democratization of institutional-grade trading tools, making sophisticated analysis and execution accessible to individual traders.
**AI-powered tools** are increasingly integrated into trading platforms, assisting with market scanning, pattern recognition, backtesting strategies, and even generating real-time risk management alerts. These tools don’t replace human judgment but help traders process vast amounts of data more efficiently and apply rules consistently. Cloud-native and API-first platforms are also gaining prominence, offering universal access and instant scalability, which is particularly beneficial during volatile market periods.
While specific market statistics for swing trading success rates in late 2026 are always fluid and vary widely by individual skill and market conditions, the general consensus is that disciplined execution and strict risk management remain paramount. Traders who adapt to market changes and continuously test their strategies tend to see better results.

The evolution of trading technology, particularly AI, is enhancing the capabilities of swing traders by providing better insights and automation for mundane tasks, allowing more focus on strategy design and market synthesis.
Practical Example: A Swing Trade Scenario 📚
Let’s consider a hypothetical swing trade using a common strategy: the Moving Average Crossover.
Trader’s Situation
- **Stock:** Tech Innovators Inc. (TINV)
- **Indicators:** 20-day Exponential Moving Average (EMA) and 50-day EMA.
- **Goal:** Capture a short-term upward swing.
Execution Process
1) **Identify Crossover:** The trader observes TINV’s daily chart. The 20-day EMA crosses above the 50-day EMA, signaling a potential bullish trend.
2) **Entry:** The trader waits for a slight pullback to the 20-day EMA and enters a long position at $100 per share, placing a stop-loss order at $97 (below a recent swing low).
3) **Exit Strategy:** A profit target is set at $106, based on a 2:1 risk-reward ratio ($3 risk for $6 potential gain), or at the next resistance level.
Final Outcome
– **Result:** Over the next five days, TINV’s price rises, hitting $106. The trader closes the position, realizing a $6 per share profit.
– **Key Takeaway:** The strategy capitalized on the momentum indicated by the moving average crossover, and the pre-defined stop-loss protected against larger losses if the trade went awry.
This example highlights the importance of a clear strategy, disciplined entry and exit points, and robust risk management. While not every trade will be a winner, consistency in applying these principles is key to long-term profitability.
Wrapping Up: Your Path to Smart Trading 📝
Swing trading offers an exciting and accessible way to engage with the stock market, bridging the gap between high-frequency day trading and long-term investing. By understanding its core principles, mastering technical indicators, and rigorously applying risk management, you can position yourself to capture those profitable market “swings.” Remember, consistent learning and adapting to market conditions are your best allies.
The world of trading is dynamic, and with the latest technological advancements in 2026, tools are more powerful than ever. Embrace them, but always prioritize your strategy and discipline. What are your thoughts on swing trading, or do you have a favorite indicator? Let me know in the comments below! 😊