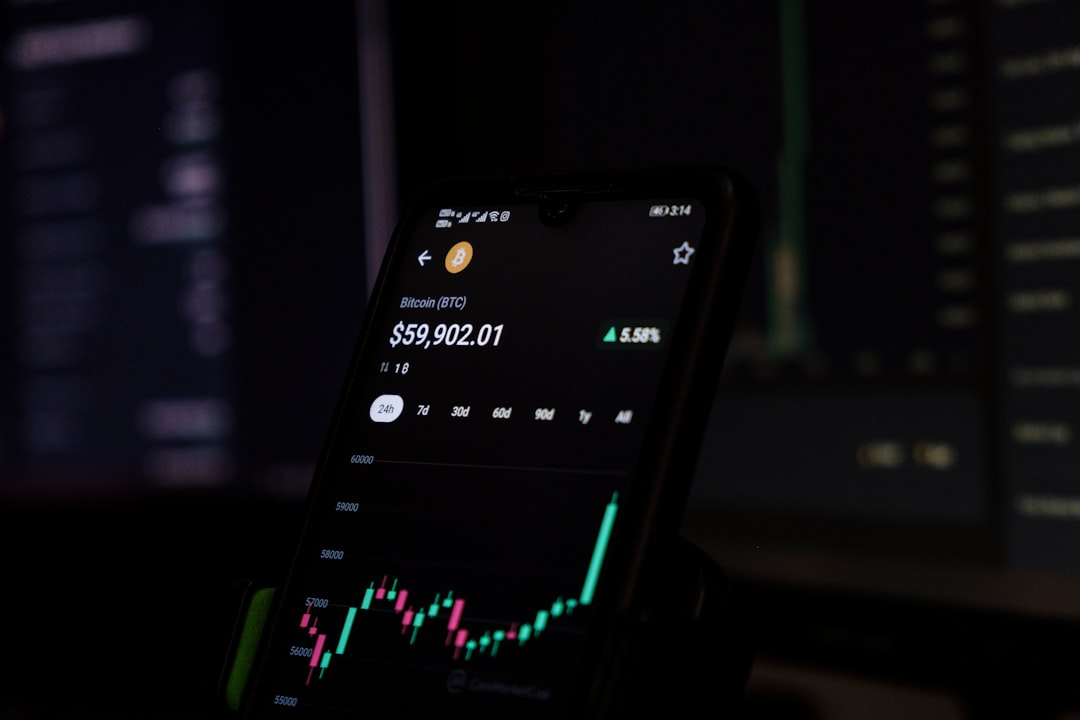
Have you ever felt overwhelmed by the sheer number of indicators and complex analyses in the Forex market? It’s a common feeling, trust me. The world of currency trading can seem like a labyrinth of charts, data, and conflicting signals. But what if I told you there’s a powerful, yet often overlooked, strategy that cuts through the noise and focuses on the purest form of market information: price itself? Today, we’re diving deep into Price Action Trading, a method that has stood the test of time and continues to be a go-to for many successful traders. Let’s simplify your trading journey! 😊
What is Price Action Trading? 🤔
Price action trading is a method where traders make decisions based solely on the raw movement of prices on a chart, without relying heavily on technical indicators. The core belief is that all market-moving events, whether economic news or geopolitical tensions, are already reflected in the price itself. By studying candlestick patterns, chart patterns, and significant historical price events, traders aim to understand supply and demand dynamics and predict future price movements.
This approach provides immediate data and clarity, allowing traders to stay attuned to what’s happening in the market at any given moment. It’s about interpreting the “story” the market is telling through its price movements, rather than an interpretation of an interpretation, which can sometimes be the case with lagging indicators.
While indicators can offer specific data analysis, they often derive their information from price action itself and can sometimes produce conflicting signals or create visual clutter. Price action trading cuts out the middleman, going straight to the source.
Key Components of a Price Action Strategy 📊
Effective price action trading involves several key components that traders use to analyze charts and make decisions. These often revolve around understanding market structure and identifying recurring patterns.
- Candlestick Patterns: Candlesticks are fundamental to price action, displaying the high, low, opening, and closing prices (HLOC) of an asset over a specified period. Patterns like pin bars, engulfing patterns, and dojis can signal potential reversals or continuation of trends.
- Support and Resistance Levels: These are price levels where the market has historically found difficulty breaking through. Identifying these key levels helps in determining potential entry and exit points, as well as placing stop-loss orders.
- Trend Lines: Drawing trend lines connects a series of higher lows in an uptrend or lower highs in a downtrend, helping to visualize the market’s direction and identify potential retracement entry points.
- Market Structure (Higher Highs/Lows, Lower Highs/Lows): Understanding the sequence of highs and lows is crucial for mapping out emerging trends. An uptrend is characterized by higher highs and higher lows, while a downtrend shows lower highs and lower lows.
For instance, a common strategy involves trading pullbacks within an established trend. In an uptrend, a trader might look for the price to retrace to a support level or trendline before entering a long position, aiming to capitalize on the continuation of the trend.
Forex Market Snapshot: 2026 Trends
The Forex market continues to be dynamic. As of April 2025, the global OTC foreign exchange turnover averaged an impressive $9.6 trillion per day, a 28% increase from 2022. Projections for 2026 estimate the daily turnover to reach around $7.5 trillion, based on the BIS 2025 baseline with a 5% year-on-year growth adjustment.
| Metric | 2025/2026 Data | Source | Significance |
|---|---|---|---|
| Global Daily FX Turnover | ~$9.6 trillion (April 2025) | BIS Triennial Survey | Shows robust market liquidity and activity. |
| Projected Daily FX Turnover (2026) | ~$7.5 trillion | BIS 2025 baseline + 5% growth | Indicates continued market expansion. |
| Most Traded Pair (2025) | EUR/USD (21.2% of turnover) | BIS 2025 data | Highlights liquidity in major currency pairs. |
| USD in allocated forex reserves (Q1 2026) | 57.13% | IMF | Reinforces the US Dollar’s global dominance. |
While price action trading can be highly effective, it is also subjective. Two traders might interpret the same price pattern differently, leading to varied trading decisions. This subjectivity requires significant practice and experience to master.
Key Checkpoints: Remember These! 📌
You’ve made it this far! With a lengthy article, it’s easy to forget the crucial details. So, let’s recap the most important takeaways. Please keep these three points in mind:
-
✅
Price Action Focus:
Prioritize raw price movements and candlestick patterns over complex indicators to understand market dynamics directly. -
✅
Identify Key Levels:
Master identifying support, resistance, and trend lines to pinpoint optimal entry and exit points. -
✅
Practice and Adapt:
Price action requires consistent practice and adaptation to market conditions, and it’s often best combined with sound risk management.
Implementing Price Action: Practical Steps 👩💼👨💻
So, how do you actually start using price action trading in your Forex strategy? It’s simpler than you might think, but it does require discipline and a keen eye for detail. Here’s a general framework:
- Choose Your Chart Type: Candlestick charts are the most popular for price action analysis because they provide all the necessary HLOC information at a glance.
- Identify the Trend on Higher Timeframes: Start by looking at daily or 4-hour charts to confirm the overall trend (higher highs/lows for uptrends, lower highs/lows for downtrends). This gives you the “bigger picture.”
- Mark Key Support and Resistance Levels: Draw horizontal lines or trend lines where the price has historically reversed or consolidated. These are potential areas for future price reactions.
- Look for Price Action Patterns at Key Levels: Once the price approaches a significant support or resistance level, observe candlestick patterns for confirmation signals. For example, a bullish pin bar at a support level could indicate buying pressure.
- Plan Your Entry, Stop-Loss, and Take-Profit: Based on your identified pattern and key levels, determine your entry point. Place your stop-loss order just beyond the key level or pattern to manage risk. Set a take-profit target at the next significant resistance or support level.
The beauty of price action is its flexibility; it can be applied to various markets and timeframes, from day trading to long-term investing. However, combining it with sound risk management is always crucial, as false signals can occur.
While price action focuses on raw charts, some traders integrate minimal indicators like moving averages to smooth price action or confirm trends without cluttering their view.
Real-World Example: Trading a Bullish Pin Bar 📚
Let’s walk through a hypothetical scenario to illustrate how a price action trader might approach a trade.

Trader’s Situation
- Currency Pair: EUR/USD (most dominant pair in 2025 with 21.2% turnover)
- Timeframe: 4-hour chart (for trend identification and entry)
- Market Condition: Established uptrend, but the price has recently pulled back to a historical support level.
Trading Process
1) Identify Support: The trader identifies a strong support level at 1.0850, where the EUR/USD has bounced multiple times in the past.
2) Observe Price Action: As the price pulls back to 1.0850, the trader watches for bullish reversal patterns. A clear bullish pin bar forms right at the support level, indicating that buyers stepped in aggressively to reject lower prices.
3) Entry: The trader enters a long position just above the high of the bullish pin bar, for example, at 1.0870.
4) Stop-Loss: A stop-loss is placed just below the low of the pin bar and the support level, for example, at 1.0830, to limit potential losses.
5) Take-Profit: The trader identifies the next significant resistance level at 1.0950 as a potential take-profit target, based on previous price action.
Final Result
– Risk-Reward: A favorable risk-reward ratio is achieved (e.g., risking 40 pips to gain 80 pips). The trade moves in the anticipated direction.
– Outcome: The EUR/USD rallies from the support, hitting the take-profit target, resulting in a profitable trade.
This example demonstrates how a price action trader uses visual cues from the chart, combined with key levels, to make precise and disciplined trading decisions. It’s about letting the market guide your actions, rather than being guided by lagging indicators.
Conclusion: Your Path to Forex Mastery 📝
Price action trading offers a powerful and direct approach to navigating the complex world of Forex. By focusing on the pure movement of price, you can develop a deeper understanding of market dynamics and make more informed decisions, free from the clutter of excessive indicators. While it demands practice and experience, the simplicity and flexibility of this strategy make it an invaluable tool for any trader aiming for consistent profitability.
Remember, the Forex market is constantly evolving, with economic data, central bank policies, and geopolitical events shaping currency movements. Staying updated with trends like the shifting interest rate expectations and the US dollar’s performance (which was part of 57.13% of allocated forex reserves in Q1 2026) is vital. Combine this market awareness with a solid price action strategy, and you’re well on your way to becoming a more confident and successful trader. Do you have any questions about implementing price action in your trading? Feel free to ask in the comments below! 😊
Price Action Trading: Key Takeaways
Frequently Asked Questions ❓
Copyright © 2025 QHost365.com ®