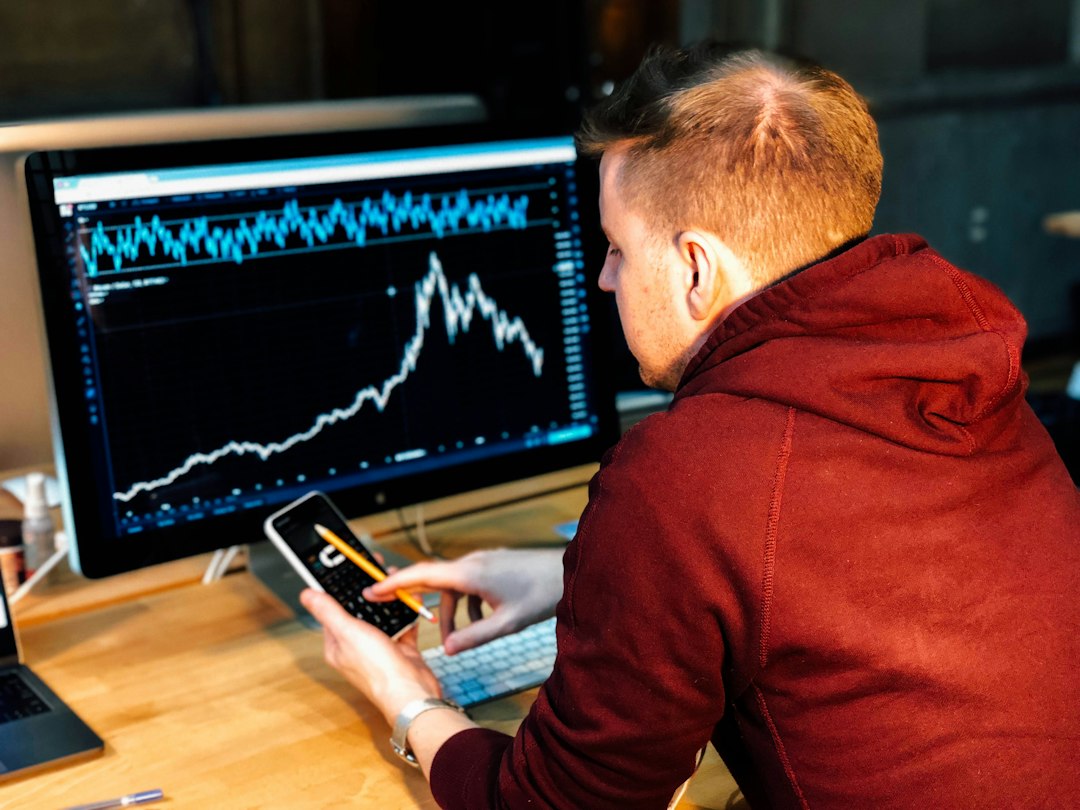
Have you ever felt caught between the rapid-fire decisions of day trading and the long-term patience of investing? Many aspiring traders find themselves in this exact spot, looking for a sweet spot that offers both excitement and tangible returns. That’s where swing trading comes in! It’s a fantastic approach that allows you to capitalize on short-to-medium-term price movements, often holding positions for a few days to several weeks. If you’re looking to actively grow your portfolio without glued to your screen all day, swing trading might just be your perfect fit. Let’s dive in! 😊
Understanding Swing Trading: Your Gateway to Mid-Term Gains 🤔
Swing trading is a popular strategy where traders hold financial instruments like stocks, currencies, or commodities for several days to a few weeks, aiming to profit from price fluctuations, or “swings,” within a larger trend. Unlike day trading, which involves buying and selling within a single day, swing trading allows for a longer investment horizon. However, it is still shorter than medium- or long-term investing. This makes it an attractive option for those who want to actively participate in the market without the intense, constant monitoring required for day trading. Swing traders typically use daily or 4-hour charts to identify trends and potential reversal points.
The goal is to enter a trade at the start of a trend or pullback and exit before it reverses, capturing a significant portion of the price move. It offers a middle ground, providing more time for research and planning compared to day trading, while potentially yielding quicker returns than a pure buy-and-hold strategy.
Swing trading can be done part-time, even with a full-time job, as it doesn’t demand continuous screen time. This flexibility is a major advantage for many aspiring traders.
The Core Mechanics: Strategies and Technical Tools for 2026 📊
Successful swing trading hinges on identifying clear trends and executing trades with discipline. In 2026, several strategies remain highly effective. One fundamental approach is trend following, which involves entering a trade in the direction of the prevailing trend and holding until signs of a reversal appear. This often means waiting for a pullback to a key support level, such as a moving average, and entering on a bullish confirmation candle.
Another powerful strategy is the breakout from consolidation. This involves identifying a stock that has been trading in a narrow range for several days or weeks, building potential energy. When the price breaks above the top of this range, especially with a surge in volume, it signals a high-probability entry point for a new upward swing.
Key Technical Indicators for Swing Trading
Technical indicators are the swing trader’s best friends, helping to analyze price action, trend direction, momentum, volatility, and volume. Here are some of the most widely used in 2026:
- Moving Averages (MA/EMA): These help identify trend direction and dynamic support/resistance levels. The 20-day and 50-day Exponential Moving Averages (EMAs) are particularly popular for short-to-medium-term trends, while the 200-day MA can confirm the long-term trend.
- Relative Strength Index (RSI): A momentum oscillator that helps identify overbought or oversold conditions, signaling potential reversals.
- Moving Average Convergence Divergence (MACD): This indicator provides trend confirmation and momentum signals, showing the relationship between two moving averages of a stock’s price.
- Bollinger Bands: Useful for gauging volatility and identifying potential mean reversion trades as prices tend to revert to the middle band.
- On-Balance Volume (OBV): A volume indicator that helps confirm price trends. Rising OBV often indicates strong buying pressure, while falling OBV suggests selling pressure.
The key is to use 2-3 indicators in combination – one for trend, one for momentum, and one for confirmation – to avoid contradictory signals and analysis paralysis.
Swing Trading vs. Other Strategies
| Category | Day Trading | Swing Trading | Long-Term Investing |
|---|---|---|---|
| Holding Period | Seconds to hours (within a day) | Days to several weeks (up to a few months) | Months to years/decades |
| Time Commitment | Full-time, constant monitoring | Part-time, daily review | Minimal, periodic review |
| Primary Focus | Intraday price movements | Medium-term price swings/trends | Company fundamentals, long-term growth |
| Risk Level | Very High | Medium to High | Low to Medium |
While technical indicators are powerful, over-reliance on a single indicator or poorly backtested strategies can lead to losses. Always use a combination of tools and confirm signals before entering a trade.
Key Checkpoints: Remember These Essentials! 📌
You’ve come this far, great job! With all this information, it’s easy to forget the most crucial points. Let’s recap the three absolute must-remembers for successful swing trading.
-
✅
Master Your Strategy:
Understand and practice your chosen swing trading strategy, whether it’s trend following or breakout trading. Don’t jump between methods. -
✅
Prioritize Risk Management:
Always define your stop-loss and position size before entering a trade, aiming for a favorable risk-reward ratio like 1:2 or 1:3. -
✅
Stay Adaptable and Informed:
The market is always changing. Keep an eye on sector performance and broad market health, and use AI tools wisely to enhance, not replace, your decision-making.
Navigating the 2026 Market: Trends and Opportunities 👩💼👨💻
The 2026 market presents a unique landscape for swing traders. We’re seeing continued strong institutional flows into AI stocks, semiconductor stocks, clean energy, and high-growth tech stocks. Companies like Nvidia (NVDA), Arm Holdings (ARM), Tesla (TSLA), and Super Micro Computer (SMCI) have shown clear chart patterns and volatility that can be ideal for swing trading.
However, market health indicators as of October 2026 suggest a mixed or poor overall market condition, with utilities leading and technology showing some weakness. This emphasizes the importance of selecting stocks carefully and aligning your trades with current sector strength. Always confirm that the daily trend aligns with the weekly trend and that the broader market is not in a distribution phase.

The rise of AI tools is also significantly impacting trading. AI-powered platforms can offer unprecedented levels of pattern recognition, risk assessment, and predictive accuracy. They can help you scan faster, compare stocks more clearly, test ideas, and monitor risk. However, it’s crucial to remember that AI should support your decisions, not replace them entirely. Backtest results from AI models can fail in live conditions due to regime shifts or overfitting, so human oversight remains essential.
In a market dominated by algorithmic players and event-driven volatility, your edge comes from a structured approach and adaptability, not just stock picking.
Risk Management: Protecting Your Capital 🛡️
No trading strategy, including swing trading, is complete without a robust risk management plan. This is the foundation of long-term success. Ignoring risk management is one of the most common mistakes traders make, often leading to significant losses.
Key components of effective risk management include:
- The 1-2% Rule: Never risk more than 1-2% of your total trading capital on a single trade. This means the maximum loss if your stop-loss is hit should be 1-2% or less of your account. This rule is standard practice for professional traders and helps preserve capital.
- Stop-Loss Orders: These are your safety net. A stop-loss order defines the maximum loss you’re willing to take on a trade and automates the exit if the price moves against you. Stop losses can be price-based (at a technical level), volatility-based (using ATR), or time-based. The key is to place your stop at a price level that invalidates your trade idea, not an arbitrary point.
- Risk-Reward Ratio: Before entering any trade, define your minimum acceptable reward relative to your risk. A typical target is a 1:2 or 1:3 risk-reward ratio, meaning your potential gain should be at least two or three times your potential loss. This allows you to be wrong more often than right and still be profitable.
- Position Sizing: This determines how many shares or contracts to trade. It’s a function of your account size, entry price, stop-loss location, and your defined risk per trade. Proper position sizing ensures that hitting your stop-loss won’t significantly impact your overall portfolio.
- Emotional Management: Fear and greed are powerful forces that can sabotage even the best-laid plans. Sticking to your pre-defined plan, accepting potential losses, and avoiding revenge trading are crucial psychological aspects of risk management.
Practical Example: A Hypothetical Swing Trade Scenario 📚
Let’s walk through a simplified example using a hypothetical scenario for a popular AI stock, Nvidia (NVDA), known for its volatility and clear chart patterns.
Trader’s Situation (October 2026)
- Stock: Nvidia (NVDA) – currently in a strong uptrend on the weekly chart.
- Observation: NVDA has pulled back to its 20-day EMA, which has previously acted as strong support. The RSI is also moving up from the 40-50 region, indicating a potential bounce.
- Account Size: $20,000
- Risk Per Trade: 1% of account = $200
Execution Process
1) Entry Confirmation: On October 15, 2026, NVDA forms a strong bullish engulfing candle closing above the 20-day EMA, confirming the bounce from support. The trader decides to enter at the next day’s open.
2) Entry Price: $480.00
3) Stop-Loss Placement: Below the swing low that formed during the pullback, at $470.00. This is a $10 risk per share.
4) Position Sizing: With a $200 risk tolerance and $10 risk per share, the trader can buy 20 shares ($200 / $10 = 20 shares).
5) Target Price (1:2 Risk-Reward): A $10 risk implies a $20 potential reward. So, target price is $480 + $20 = $500.00.
Potential Outcome
– Scenario 1 (Successful Trade): NVDA continues its uptrend and reaches $500.00 within a week. The trader exits for a profit of $20 x 20 shares = $400.
– Scenario 2 (Unsuccessful Trade): NVDA reverses and hits the stop-loss at $470.00. The trader exits for a loss of $10 x 20 shares = $200 (1% of account). This controlled loss protects capital for future opportunities.
This example illustrates how a disciplined approach, combining technical analysis with strict risk management, can lead to profitable outcomes while limiting downside risk. It’s about planning your trade and trading your plan.
Conclusion: Your Path to Confident Swing Trading 📝
Swing trading offers a dynamic and rewarding path for those looking to engage with the stock market beyond long-term investing. By understanding core strategies like trend following and breakout trading, mastering essential technical indicators, and rigorously applying risk management principles, you can significantly increase your chances of success. The 2026 market, with its focus on AI and high-growth sectors, presents ample opportunities, but vigilance and adaptability are key.
Remember, consistent profitability in swing trading isn’t about avoiding losses entirely; it’s about managing them effectively and letting your winning trades outweigh your losing ones. Stay informed, stay disciplined, and keep refining your approach. Your trading journey is a continuous learning process. If you have any questions or want to share your swing trading experiences, please leave a comment below! 😊