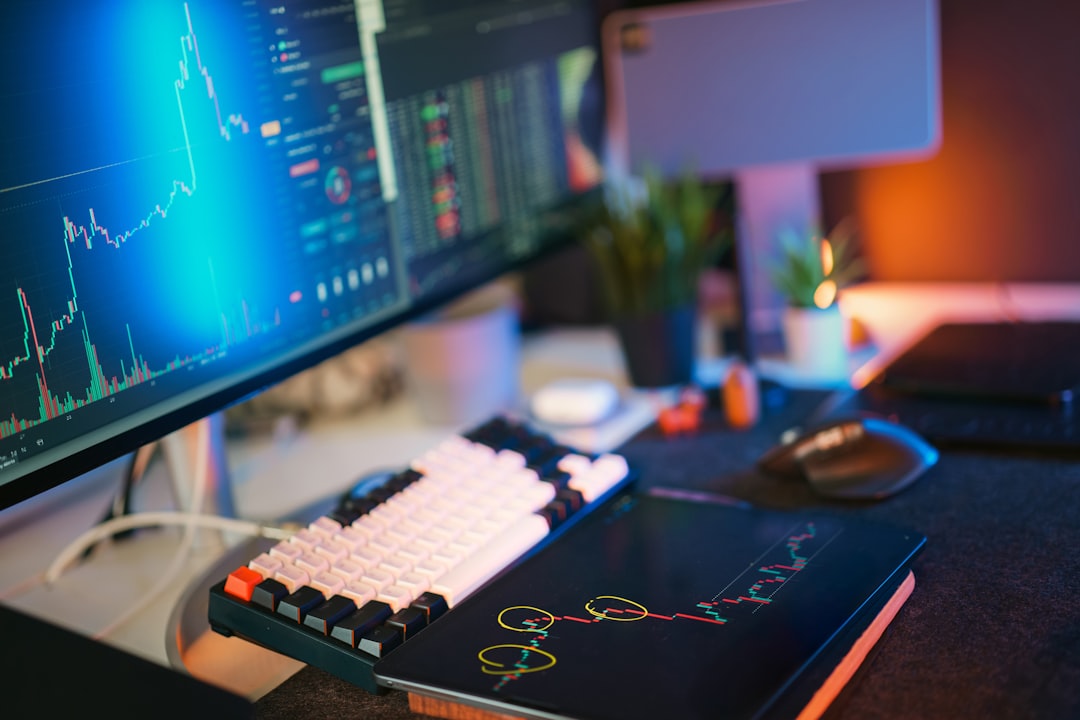
Have you ever felt caught between the rapid-fire intensity of day trading and the long-term patience of investing? Many traders find themselves in this exact spot, seeking a strategy that offers frequent opportunities without demanding constant screen time. That’s where swing trading shines! It’s a dynamic approach that lets you capitalize on price “swings” over days or weeks, making it ideal for those with busy schedules. If you’re looking to understand the nuances of this powerful trading method and how to apply it effectively in today’s market, you’re in the right place. Let’s dive in! 😊
What Exactly is Swing Trading? 🤔
Swing trading is a trading strategy that aims to capture short-to-medium term price movements in financial markets, typically holding positions for a few days to several weeks. It sits comfortably between the rapid execution of day trading and the extended holding periods of long-term investing. Unlike day traders who close all positions before the market closes, swing traders carry positions overnight and sometimes over weekends, seeking to profit from one complete directional move within a larger trend.
The core idea is simple: stocks don’t move in straight lines. They trend in waves—up, consolidate, up again, or down, bounce, down again. Swing traders aim to catch one of these directional waves and exit before the next reversal. This approach requires a clear understanding of price trends, momentum, and patterns, making technical analysis a cornerstone of the strategy.
In 2026, the flexibility and less demanding time commitment of swing trading are making it increasingly popular, especially for individuals with full-time jobs who still want to actively participate in the markets.
The 2026 Market Landscape for Swing Traders 📊
The financial markets in 2026 present a unique environment for swing traders. We’re seeing a landscape influenced by algorithmic trading, event-driven volatility, and fragmented momentum. This means the traditional “buy and hold for 3-5 days” approach is evolving, with a greater emphasis on structured strategies over simple stock picking.
Key market dynamics in mid-2026 include persistent, albeit cooling, inflation, and central banks, like the Federal Reserve, easing policy rates while still operating in an elevated rate environment compared to pre-2020. Geopolitical conflicts and energy prices continue to introduce uncertainty and volatility. Interestingly, the US move to T+1 settlement has shortened settlement times, which can benefit active traders. Furthermore, sectors related to Artificial Intelligence (AI) infrastructure are experiencing massive spending cycles, leading to concentrated leadership but also broadening opportunities in financials and value-oriented equities.
Key Market Factors & Their Impact on Swing Trading in 2026
| Factor | Description | Impact on Swing Trading |
|---|---|---|
| Algorithmic Trading | Dominates market flow, leading to rapid price movements. | Requires precise entries/exits and robust risk management. |
| Market Volatility | Geopolitical events, energy prices, and central bank shifts contribute to price swings. | Creates frequent opportunities but demands careful timing and wider stops. |
| AI Sector Growth | Massive investment in AI infrastructure driving strong trends in related stocks. | Offers potential for significant momentum plays. |
| T+1 Settlement | Shortened settlement times for trades. | Reduces operational drag and allows faster capital reallocation. |
While swing trading can be profitable, estimates suggest that only about 10% of swing traders consistently generate profits over a year. This highlights the critical importance of a well-defined strategy, disciplined risk management, and continuous education.
Core Swing Trading Strategy: Pullback to a Key Moving Average 📌
Among the myriad of swing trading techniques, the “Pullback to a Key Moving Average” strategy stands out as a fundamental and highly effective method, particularly for beginners. This strategy capitalizes on the natural ebb and flow of trending stocks. Here’s how it works:
-
✅
Identify a Strong Trend:
The first step is to identify a stock in a clear uptrend (for long trades) or downtrend (for short trades). The 50-day and 200-day Moving Averages (MAs) are excellent tools for this. For swing trading, the 50-day MA is often considered the clearest line between bullish and bearish structure on a daily chart. -
✅
Wait for a Pullback:
Once a strong trend is established, avoid chasing the stock at its highs. Instead, wait for a healthy pullback to a key support level or a rising moving average, such as the 21-day Exponential Moving Average (EMA). The 21 EMA often acts as a dynamic support in uptrending stocks. -
✅
Confirm Entry with a Bullish Signal:
Enter the trade only when a bullish confirmation candle (e.g., hammer, bullish engulfing, strong inside-day break) prints at the support level or moving average. This confirms that buyers are stepping in and the pullback may be ending.
Essential Indicators and Tools for 2026 Swing Traders 👩💼👨💻
To effectively execute swing trading strategies, particularly the “pullback to MA” method, leveraging the right technical indicators and modern trading tools is paramount. Technical analysis forms the backbone of swing trading, providing insights into market trends, momentum, and potential reversal points.
Here are some of the most effective indicators for swing trading in 2026:
- Moving Averages (MA/EMA): As discussed, these are crucial for identifying trends and dynamic support/resistance levels. The 9, 21, 50, and 200-period EMAs are commonly used.
- Relative Strength Index (RSI): A momentum oscillator measuring the speed and change of price movements. Key levels are below 30 (oversold) and above 70 (overbought). RSI is particularly useful when it diverges from price action.
- MACD (Moving Average Convergence Divergence): A trend-following momentum indicator that shows the relationship between two moving averages. It generates buy/sell signals.
- Average True Range (ATR): Essential for risk management, ATR measures market volatility and helps in setting appropriate stop-loss distances.
- Williams %R: This lesser-known but highly effective momentum oscillator is praised for its stability and solid performance in swing trading scenarios.
In terms of platforms and tools, 2026 offers a robust ecosystem. Platforms like ChartingLens, TradingView, and TrendSpider are highly rated for their comprehensive charting, screening, and analysis capabilities. Interactive Brokers and MetaTrader 4/5 provide professional-grade tools and execution. Many platforms now offer advanced screeners to filter stocks by technical criteria and backtesting features to validate strategies with historical data.
AI-powered scanners, such as Trade Ideas’ Holly AI, are becoming increasingly sophisticated, though many are still optimized for intraday opportunities rather than multi-day swing setups. However, their raw capability for real-time pattern recognition is impressive.
Real-World Example: Capturing a Pullback Swing 📚
Let’s walk through a hypothetical scenario to illustrate the “Pullback to a Key Moving Average” strategy in action, keeping in mind the current market dynamics of mid-2026.
Scenario: Tech Sector Leader ($TECHCO)
- Market Context (July 2026): The broader market is experiencing moderate volatility, with the AI sector showing strong underlying trends.
- Stock Observation: $TECHCO, a prominent AI infrastructure stock, has been in a clear uptrend for several months, consistently trading above its rising 50-day EMA.
- Recent Action: After a strong surge, $TECHCO experiences a minor pullback, returning towards its 21-day EMA. The RSI is pulling back from overbought territory (above 70) towards the 50-60 range, indicating a healthy reset.
Trading Process
1) Entry Signal: As $TECHCO’s price touches the 21-day EMA, a strong bullish engulfing candle forms on the daily chart, accompanied by above-average volume. This confirms buying interest at the dynamic support.
2) Risk Management: A stop-loss is placed just below the low of the bullish engulfing candle, or 1.5-2 times the Average True Range (ATR) below the entry price, to account for volatility. The position size is calculated to risk no more than 1-2% of the total trading capital.
3) Target Setting: The first profit target is set at the previous swing high. A second target could be a 127% or 161.8% Fibonacci extension of the recent pullback, aiming for a minimum 1:3 risk-reward ratio.
Potential Outcome
– Holding Period: The trade is held for 3-7 trading days as $TECHCO resumes its uptrend, reaching the first target.
– Profit Realization: The trade yields a 5-10% profit on the capital allocated, demonstrating how capturing a single “swing” can lead to attractive returns. Experienced traders can achieve 12-45% per trade.
This example illustrates how combining trend identification, dynamic support, and a clear confirmation signal, along with stringent risk management, can create a high-probability swing trade setup. The key is patience and discipline, allowing the trade to develop without micromanaging.

Wrapping Up: Key Takeaways for Swing Trading Success 📝
Swing trading in 2026 offers compelling opportunities for those who approach the market with a structured plan and disciplined execution. It’s a strategy that can fit into a busy lifestyle while still generating significant returns.
Remember, success in swing trading isn’t about finding a magic indicator; it’s about consistently applying a tested strategy, managing your risk, and adapting to ever-changing market conditions. Keep learning, stay disciplined, and always prioritize protecting your capital. If you have any questions or want to share your swing trading experiences, feel free to leave a comment below! 😊