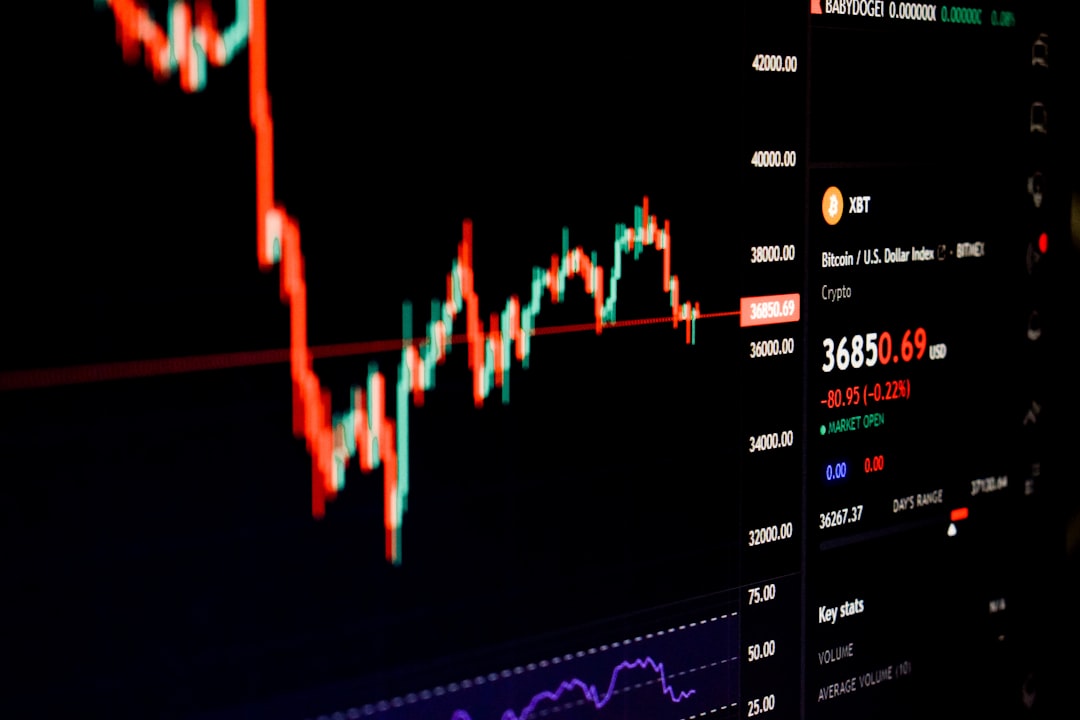
Ever felt like the stock market is a rollercoaster, with prices constantly moving up and down? While long-term investing has its merits, what if you could capitalize on those shorter, more frequent movements? That’s where swing trading comes in, offering a compelling way to generate profits without the intense, minute-by-minute focus of day trading. If you’re ready to explore a strategy that balances active participation with a manageable time commitment, you’ve come to the right place! 😊
What Exactly is Swing Trading? 🤔
Swing trading is a speculative trading strategy in financial markets where you hold a tradable asset for one or more days, typically several days to weeks, to profit from anticipated price changes or “swings”. Unlike day traders who close positions within the same trading day, swing traders aim to capture a portion of a broader price move, allowing for market movements to unfold at a slower pace. It sits comfortably between the fast-paced world of day trading and the long-term horizon of position trading.
The core idea is that investments rarely move in a straight line; they tend to rise and fall over time. Swing traders believe this process is predictable enough to identify entry and exit points, aiming to buy near the bottom of a cycle and sell near the top, or vice versa by shorting the investment. This approach can be applied to various financial markets, including stocks, bonds, and commodities.
Swing trading is often ideal for those who cannot dedicate all day to monitoring the markets, as positions are held for longer than a single day, reducing the need for constant screen time.
Key Indicators and Tools for Successful Swing Trading 📊
Successful swing traders heavily rely on technical analysis to forecast price movements and identify optimal entry and exit points. While fundamental analysis might serve as an additional filter, the primary focus is on studying price and volume trends. Here are some of the most effective indicators frequently used in swing trading, with insights relevant for 2026:
Top Swing Trading Indicators (2026 Focus)
| Indicator | Description | Swing Trading Use | 2026 Relevance |
|---|---|---|---|
| Moving Averages (MA) | Smooths out price data to identify trends. Popular periods include 20, 50, and 200-day EMAs. | Identifies trend direction and dynamic support/resistance levels. Buy when price is above MA in an uptrend, sell when below in a downtrend. | Remains a cornerstone for confirming trends in volatile markets. |
| Relative Strength Index (RSI) | A momentum oscillator measuring the speed and change of price movements. Typically, above 70 is overbought, below 30 is oversold. | Identifies potential reversal points when a stock is overbought or oversold. RSI divergences are powerful timing signals. | Crucial for identifying short-term reversals in an increasingly reactive market environment. |
| MACD (Moving Average Convergence Divergence) | A trend-following momentum indicator showing the relationship between two moving averages. | Confirms trend direction and momentum. Bullish MACD cross above zero is a strong buy signal. | Helps confirm the strength of a swing move amidst rapid market shifts. |
| Bollinger Bands | Consist of a simple moving average and two standard deviation lines, indicating volatility. | Identifies volatility extremes and potential mean reversion opportunities. Price touching the upper band might signal overbought, lower band oversold. | Essential for navigating the increased market volatility observed in 2025-2026. |
While these indicators are powerful, no single indicator guarantees success. It’s often recommended to combine 2-3 indicators for optimal results and better signal confirmation.
Key Checkpoints: Remember These Essentials! 📌
You’ve made it this far! With all this information, it’s easy to forget the crucial points. Let’s recap the three most important takeaways you should always keep in mind.
-
✅
Understand the “Swing” Concept
Swing trading aims to profit from price fluctuations over several days to weeks, differing from day trading’s intraday focus and long-term investing’s extended horizon. -
✅
Master Technical Analysis
Technical indicators like MA, RSI, MACD, and Bollinger Bands are your primary tools for identifying entry and exit points. Combine them for stronger signals. -
✅
Prioritize Risk Management
Always define your risk tolerance, use stop-loss orders, and size your positions appropriately to protect your capital, especially in volatile markets.
Recent Trends and Market Insights for Swing Traders (2026) 👩💼👨💻
As we navigate 2026, the financial markets continue to evolve at a rapid pace. Volatility regimes matter more than just predicting market direction. Markets are flipping between compression and expansion faster than before, meaning traders need to be “volatility-aware” rather than solely directional. This dynamic environment, characterized by factors like persistent inflation, interest rate expectations, energy prices, and geopolitical risks, makes adaptive strategies crucial.
According to a December 2025 analysis, swing trading in 2026 rewards traders who respect market structure, manage risk, and adapt in real-time. The edge increasingly comes from context and discipline rather than any single setup. Breakouts, while still present, are harder to trade consistently due to liquidity fragmentation and algorithmic trading. Instead, identifying when a range is likely to expand offers better opportunities.
Specific sectors like Artificial Intelligence (AI) and Energy continue to present significant swing trading opportunities in 2026. AI is seen as a “volatility engine” with momentum bursts after consolidation, while Energy provides more structural trends. Understanding these themes and adjusting position size and holding periods accordingly is key.

The increased sensitivity of financial markets to economic headlines in 2026 means that risk management, especially through stop-loss orders and appropriate position sizing, is more critical than ever for swing traders.
Practical Example: A Swing Trade Scenario 📚
Let’s walk through a hypothetical swing trade scenario to see how these concepts come together. Imagine it’s early 2026, and you’re monitoring a mid-cap tech stock, “InnovateCo (ICO),” which has shown consistent price swings within a channel.
InnovateCo (ICO) Situation
- **Observation:** ICO’s price has recently pulled back to its 50-day Exponential Moving Average (EMA) after a strong uptrend.
- **RSI:** The Relative Strength Index (RSI) has dipped below 40, suggesting it’s entering an “oversold” zone within the context of an uptrend.
- **MACD:** The MACD histogram shows weakening bearish momentum, indicating a potential reversal.
Trading Process
1) **Entry Point:** Based on the confluence of the 50-day EMA support, oversold RSI, and weakening bearish MACD, you decide to enter a long position at $75 per share.
2) **Stop-Loss:** To manage risk, you place a stop-loss order at $72, just below a key support level and previous swing low. This limits your potential loss to $3 per share.
3) **Take-Profit Target:** You identify a previous swing high and a resistance level at $82 as a realistic take-profit target, aiming for a $7 gain per share.
Final Outcome
– **Result:** Over the next few days, ICO bounces off the 50-day EMA, and its price climbs steadily as the RSI moves out of oversold territory and the MACD turns bullish. Within a week, the stock reaches $82.
– **Profit:** You successfully exit the trade at $82, realizing a profit of $7 per share (before commissions). This aligns with a favorable risk/reward ratio (7:3).
This example illustrates how combining multiple technical indicators and adhering to a predefined risk management plan can lead to profitable swing trades. Remember, discipline in execution is just as vital as identifying the right setup.
Conclusion: Summarizing Your Path to Swing Trading Success 📝
Swing trading offers a dynamic and potentially lucrative way to engage with the stock market, allowing you to capture short-to-medium term price movements. It demands a solid understanding of technical analysis, diligent risk management, and the discipline to execute your strategy consistently. While the market environment in 2026 emphasizes adaptability and volatility awareness, the core principles of identifying trends, using reliable indicators, and protecting your capital remain timeless.
By dedicating time to learning, practicing, and refining your approach, you can navigate the market’s swings with greater confidence. Remember that every trading strategy carries risks, and it’s essential to continually educate yourself and adapt to changing market conditions. Got more questions about swing trading or want to share your experiences? Feel free to leave a comment below! 😊